

Central question
Can daily Bitcoin tweet sentiment improve next-day volatility prediction beyond market-only features?
Project overview
This project links tweet-level language with daily Bitcoin market data, moving from data auditing and text preparation to topic discovery, sentiment scoring and time-aware model evaluation.
The aim was not to force a positive result. The analysis tests whether sentiment adds genuine predictive value over market variables and keeps the limitations visible when it does not.
144 observed sentiment days
Final six-topic NMF solution
Broad crypto / Ethereum cluster
Market-only baseline; all models were negative
Evidence summary
The findings behind the conclusion
Five visuals and two compact tables summarise the data, model comparisons and forecasting results.01 · Data audit
A large tweet dataset became a small daily forecasting sample
The distinction between tweet-level scale and time-series sample size shaped every modelling decision.| Measure | Result | How to read it |
|---|---|---|
| Tweets scored | 102,896 | VADER sentiment pipeline |
| Unique cleaned texts | 60,637 | Input to final topic model |
| Observed sentiment days | 144 | 7 Apr-30 Aug 2022 |
| Typical daily capture | 720 | Median tweets per observed day |
| Model-ready days | 137 | After market alignment and rolling features |
| Chronological test days | 28 | 3-30 Aug 2022 |
What it showsThe sentiment pipeline scored 102,896 tweets across 144 observed days. Rolling features and market alignment produced 137 model-ready daily rows, including a 28-day chronological test period.
Why it mattersThousands of tweets on one day do not create thousands of independent forecasting observations. The effective sample for next-day volatility was daily, not tweet-level.
LimitationDaily capture was concentrated near 720 tweets and 19-20 July had no daily rows. Tweet volume is therefore a collection measure, not a complete proxy for public attention.
02 · Topic modelling
One broad crypto theme dominated the conversation
The final six-topic NMF solution revealed a highly uneven mix of broad crypto language, expressive posts and smaller promotional clusters.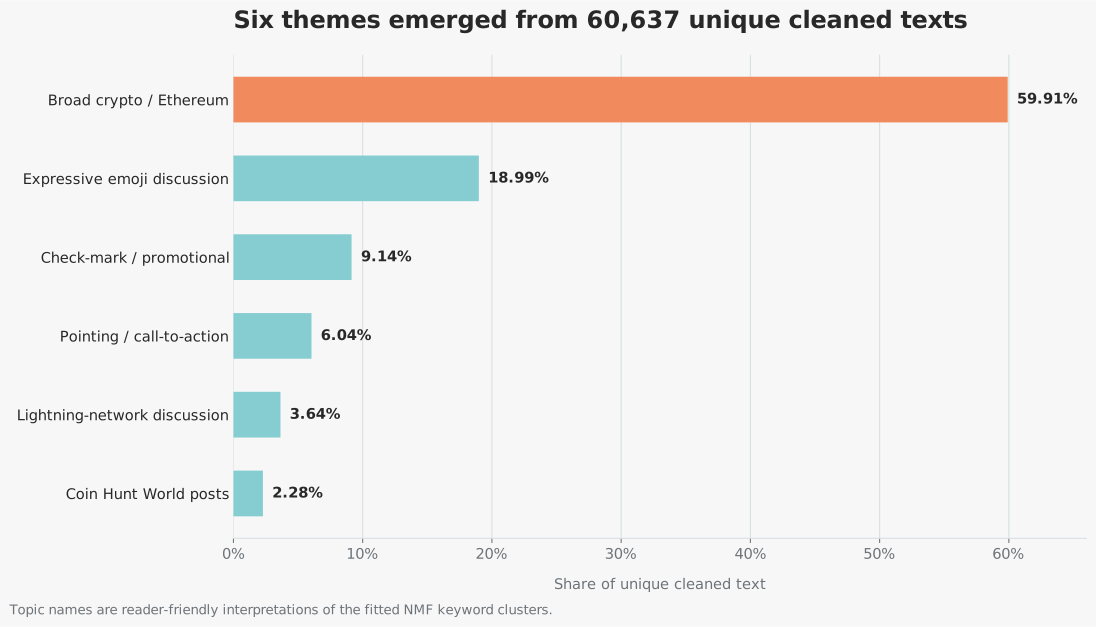
What it showsBroad crypto and Ethereum language accounted for 59.91% of unique cleaned texts. Expressive emoji discussion contributed 18.99%, while the remaining four themes each represented less than 10%.
Why it mattersThe discourse was not organised into equally distinct Bitcoin narratives. A large general-crypto cluster can dilute any relationship between a narrow Bitcoin signal and market volatility.
LimitationThe public-facing topic names are interpretations of keyword clusters. They improve readability without changing the fitted model, yet they are not hand-coded semantic categories.
03 · Sentiment profile
Positive language was common, not automatically predictive
VADER classified tweet tone at the observation level before the scores were aggregated into daily forecasting features.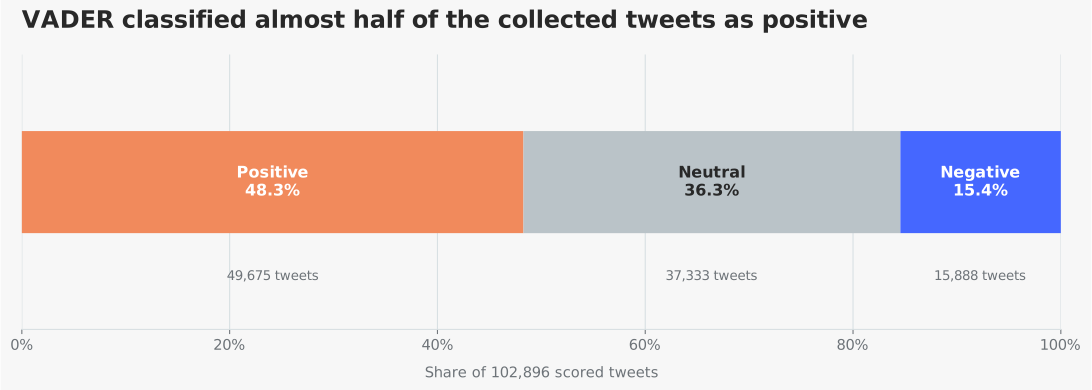
What it showsPositive tweets formed 48.3% of the sample, neutral tweets 36.3% and negative tweets 15.4%. The mean compound score was 0.220, while the median was zero.
Why it mattersA positive overall tone establishes the dataset's baseline. Forecasting depends on changes in that tone and their timing, not on the positive share alone.
LimitationThe exported 100-tweet manual-validation sample has not yet been labelled. No human-verified VADER accuracy estimate is presented, and multilingual or promotional posts may be misclassified.
04 · Sentiment and volatility
The daily relationships were weak
Pearson correlations provide a transparent first view of how the sentiment features moved with next-day absolute return.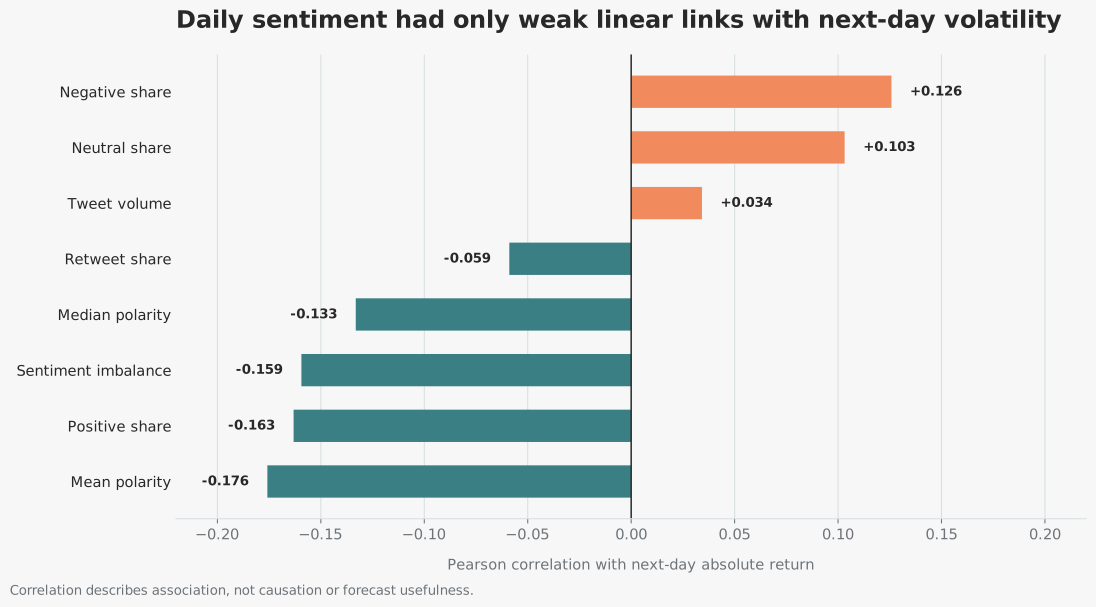
What it showsMean polarity had the largest negative correlation with next-day absolute return (r = −0.176). Negative tweet share had the largest positive correlation (r = 0.126), while tweet volume was close to zero (r = 0.034).
Why it mattersThe directions are plausible-more negative language aligned with slightly larger next-day moves-yet the magnitudes are too small to establish a strong standalone signal.
LimitationThese bivariate correlations do not control for market conditions, feature overlap or changing relationships through time. They describe association, not causation.
05 · Out-of-sample model comparison
Sentiment changed the ranking signal, not the forecast error
A market-only linear model was compared with sentiment-enhanced linear and random-forest alternatives on the final 28 days.| Model | MAE | RMSE | SMAPE | R² | Correlation | High-vol. accuracy |
|---|---|---|---|---|---|---|
| Market-only linear | 1.75% | 2.27% | 81.6% | −0.153 | −0.022 | 32.1% |
| Market + sentiment linear | 1.78% | 2.30% | 79.6% | −0.184 | 0.256 | 35.7% |
| Market + sentiment forest | 1.78% | 2.33% | 79.9% | −0.218 | −0.026 | 35.7% |
What it showsThe market-only baseline achieved the lowest MAE and RMSE. Adding sentiment raised prediction correlation to 0.256 and high-volatility accuracy to 35.7%, while MAE, RMSE and R² all moved in the wrong direction.
Why it mattersNo enhanced model delivered a dependable forecasting gain. All three test R² values were negative, meaning they underperformed a constant test-mean prediction on that metric.
LimitationThe test set covers only 28 consecutive days. Results may be sensitive to the particular volatility events in August 2022 and require rolling-window validation over a longer period.
06 · Forecast trace
The models smoothed over the largest shocks
A day-by-day comparison shows why the aggregate error metrics remained weak.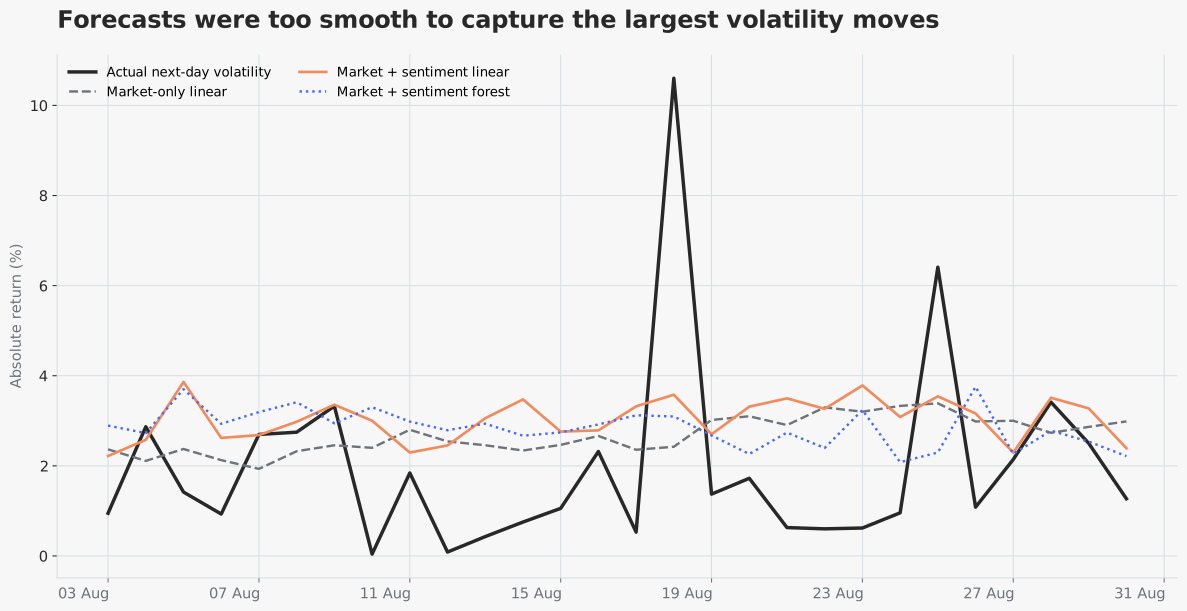
What it showsThe largest observed targets reached 10.6% and 6.4%, while all three forecasts remained mostly between 2% and 4%. The models followed a narrow central band rather than the sharp changes in realised absolute return.
Why it mattersA volatility model must recognise extreme moves, not only the average level. Missing the largest events limits its value for risk management and decision-making.
LimitationThe chart covers one short holdout period and uses next-day absolute return as the volatility proxy. Alternative targets and longer evaluation windows may lead to different conclusions.
07 · Model interpretation
Sentiment entered the forest, yet no feature rescued performance
Feature importance helps explain what the random forest used; it does not overturn the weak out-of-sample result.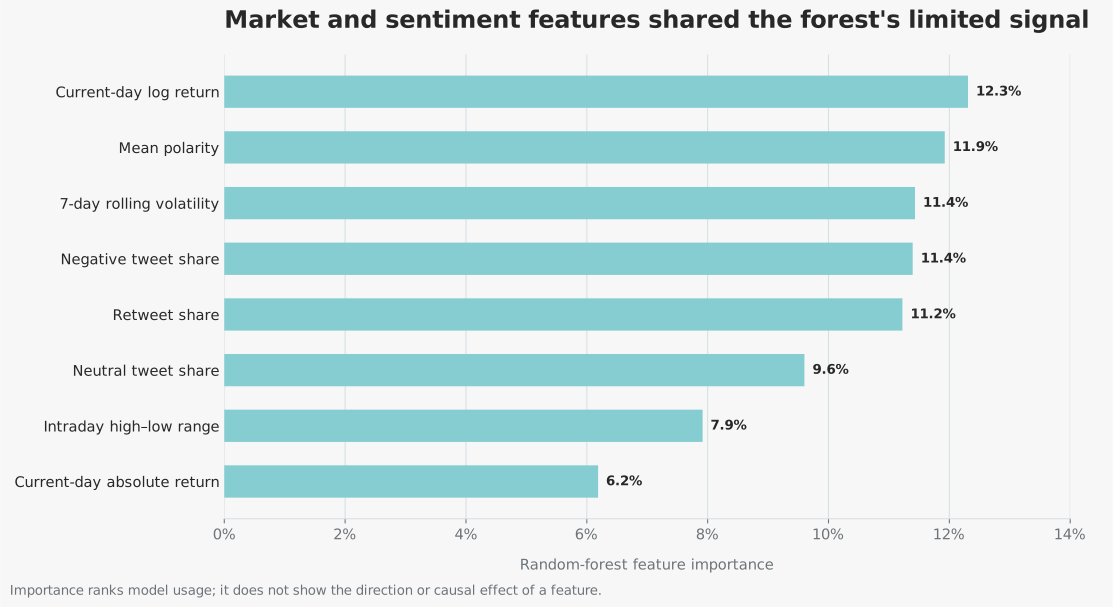
What it showsCurrent-day log return ranked first at 12.3%, followed by mean polarity at 11.9%, seven-day rolling volatility and negative tweet share at roughly 11.4% each.
Why it mattersThe model drew on both market and social features rather than ignoring sentiment completely. Predictive use still did not translate into lower test error.
LimitationImpurity-based importance can favour features with more split opportunities and does not indicate effect direction, stability or causality.
A data-quality finding that changed the analysis
Daily tweet counts clustered around 720 observations, indicating a fixed-rate collection process rather than a complete measure of public attention. No daily sentiment rows were available for 19 and 20 July 2022. Tweet volume was therefore retained with a clear warning and was not treated as an unrestricted proxy for market interest.
Topic modelling and sentiment analysis used different cleaning rules. Topic text was normalised to reveal themes, while sentiment text retained capitalisation, punctuation, negation and emojis that VADER uses as intensity signals.
Topic modelling findings
The six-topic solution was dominated by a broad crypto and Ethereum cluster, representing 59.91% of unique cleaned text. A second cluster, driven largely by expressive emoji language, represented 18.99%. The remaining groups were smaller and included check-mark, lightning-network and promotional patterns.
The result was analytically useful even though several automatic labels were noisy: it showed that the conversation was broad, repetitive and partly promotional rather than a clean set of distinct Bitcoin market themes.
Forecasting result
A market-only linear baseline was compared with a market-plus-sentiment linear model and a random forest using a chronological 80/20 split. Every feature row used information available by the end of day t, while the target was next-day absolute return, preventing future information from entering the predictors.
Sentiment increased prediction correlation from −0.022 to 0.256 and raised high-volatility classification accuracy from 32.1% to 35.7%. It did not improve MAE, RMSE or out-of-sample R². All three R² values were negative, so the honest conclusion is that this feature set did not produce a reliable next-day volatility forecast.
What the project demonstrates
The strongest result is the workflow itself: careful data auditing, purpose-specific text preprocessing, reproducible topic evaluation, leakage-aware forecasting and restrained interpretation. The project shows that a technically complete analysis can still end with a defensible negative result.
- Audited collection gaps and identified the fixed-rate sampling pattern.
- Compared LDA and NMF topic representations using coherence, diversity and stability evidence.
- Built transparent daily VADER sentiment features and exported a reproducible 100-tweet validation sample for manual labelling.
- Evaluated market-only and sentiment-enhanced models on future observations.
People behind the project