

Central question
How closely does a data-driven Bayesian network agree with an expert vehicle model, and what can the fitted network infer about fuel-economy categories?
Project overview
This project uses the Auto MPG dataset to model relationships among fuel economy, cylinders, displacement, horsepower, weight, acceleration, model year and origin. Continuous variables were converted into ordered categories so that discrete Bayesian-network structures and conditional probability tables could be estimated.
Two modelling views were compared. The expert graph encoded plausible vehicle relationships in advance, while hill climbing with the Bayesian Information Criterion searched for a smaller structure supported by the observed data.
8 model variables, no missing values
Expert and learned structures
MPG 17.65 to 21.3 at weight 3,000
Not an out-of-sample estimate
Evidence summary
From vehicle data to a probabilistic dependency model
Six evidence sections compare the graph structures, demonstrate posterior inference and assess the fitted network's reconstruction performance.01 · Data and discretisation
The network models eight variables across 392 complete vehicle records
Continuous measurements were converted into ordered categories before discrete structure and parameter learning.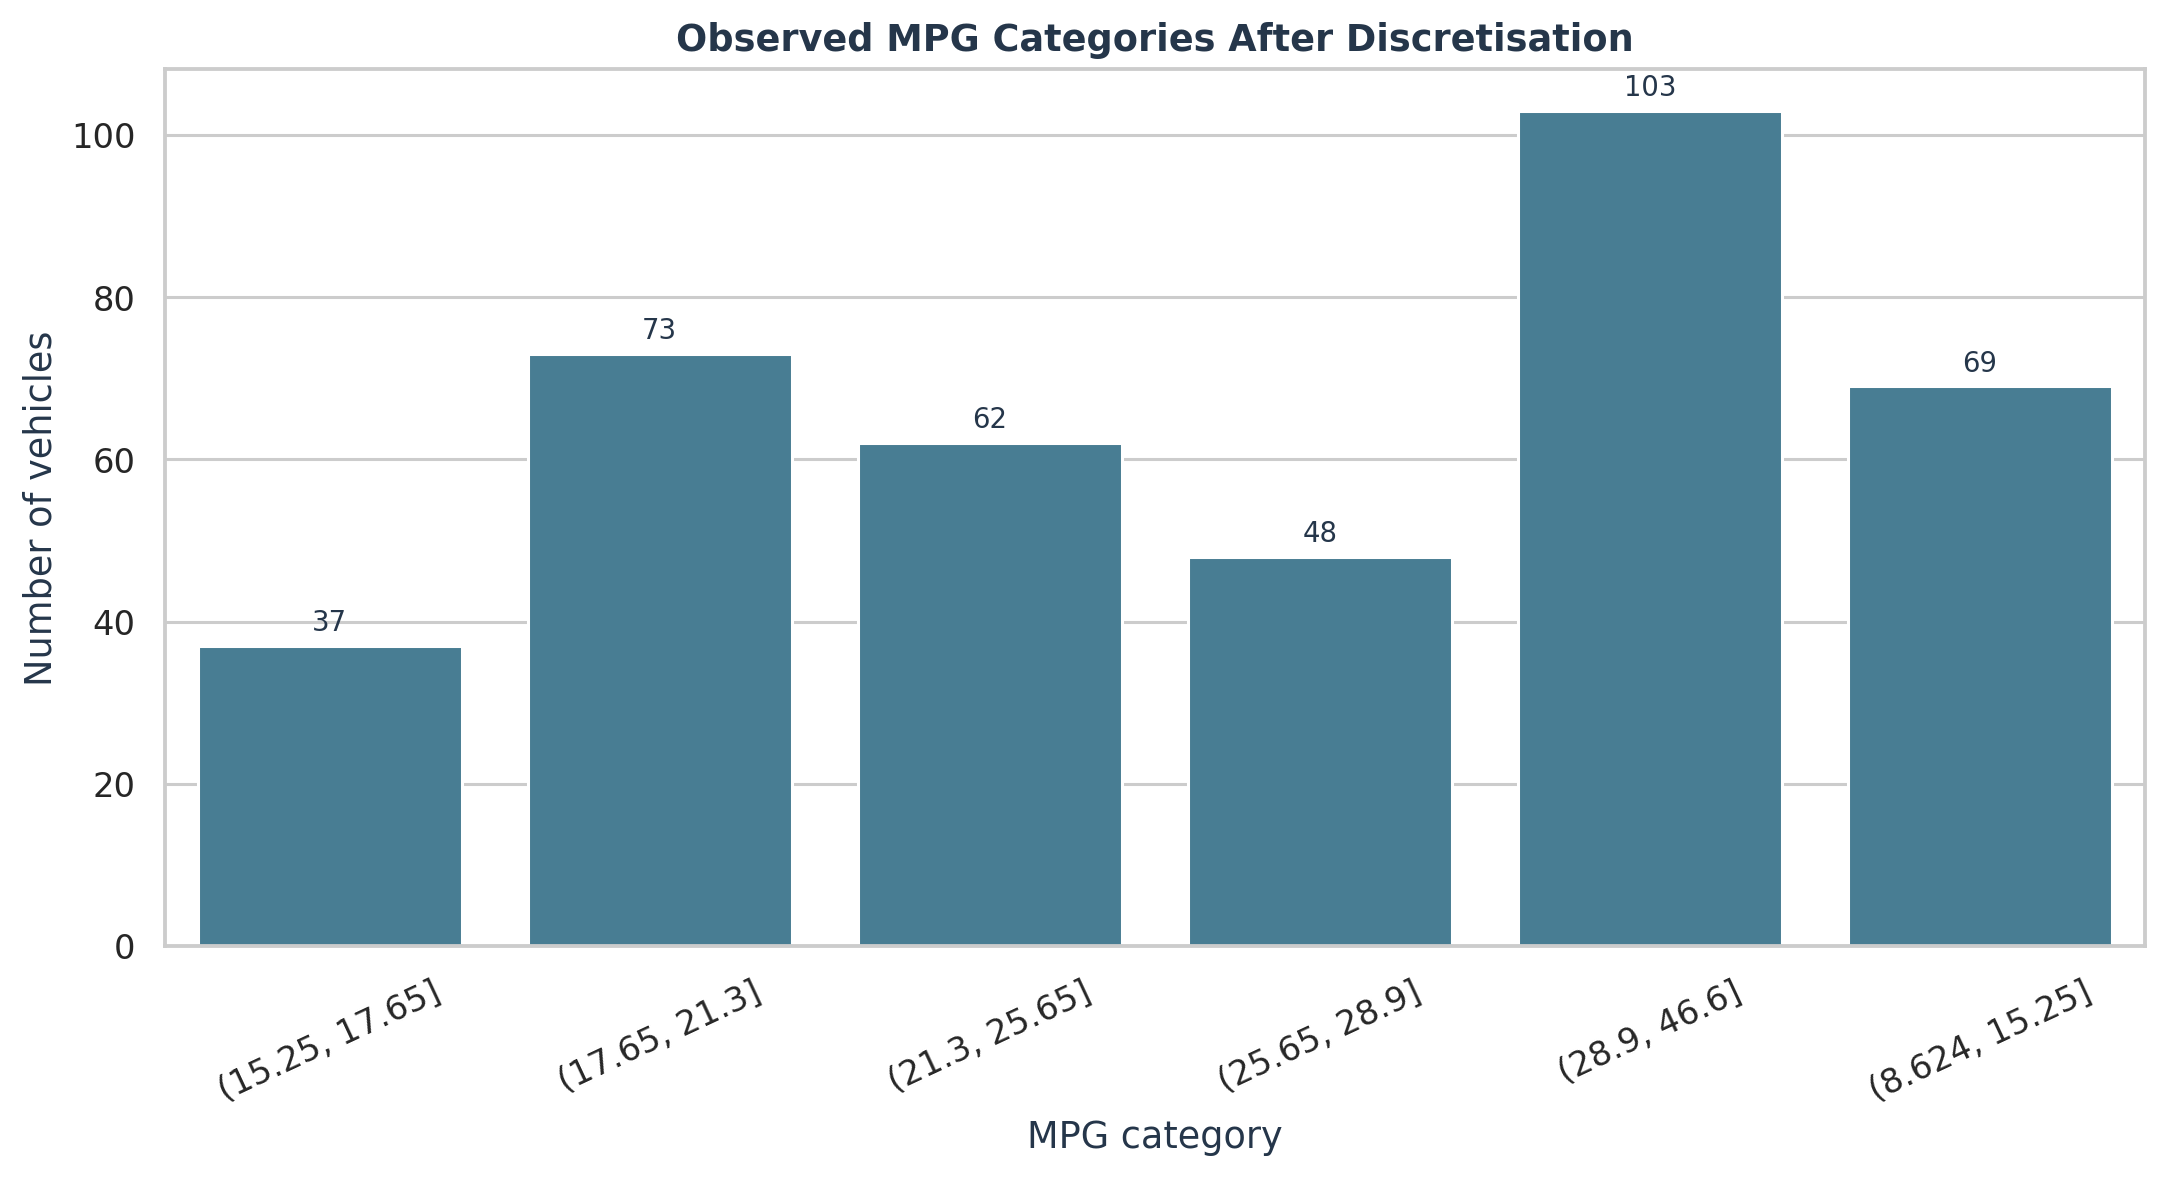
| Measure | Result | Interpretation |
|---|---|---|
| Vehicle records | 392 | All rows used in the fitted model |
| Variables | 8 | MPG plus seven vehicle characteristics |
| Missing values | 0 | No imputation required |
| Duplicate rows | 0 | No exact repeats |
| MPG categories | 6 | Ordered fuel-economy intervals |
What it showsThe dataset contains 392 rows, eight variables, no missing values and no duplicate rows. MPG was divided into six categories containing between 37 and 103 vehicles.
Why it mattersA discrete Bayesian network requires clearly defined states. Showing the resulting class balance makes the later classification metrics and confusion matrix easier to interpret.
LimitationDiscretisation removes differences within each interval. Alternative cut-points could change class balance, learned edges, conditional probabilities and predictions.
02 · Structure comparison
Expert knowledge produced a richer graph than BIC-based hill climbing
The expert structure encoded eight directed relationships, while the pruned learned structure retained five.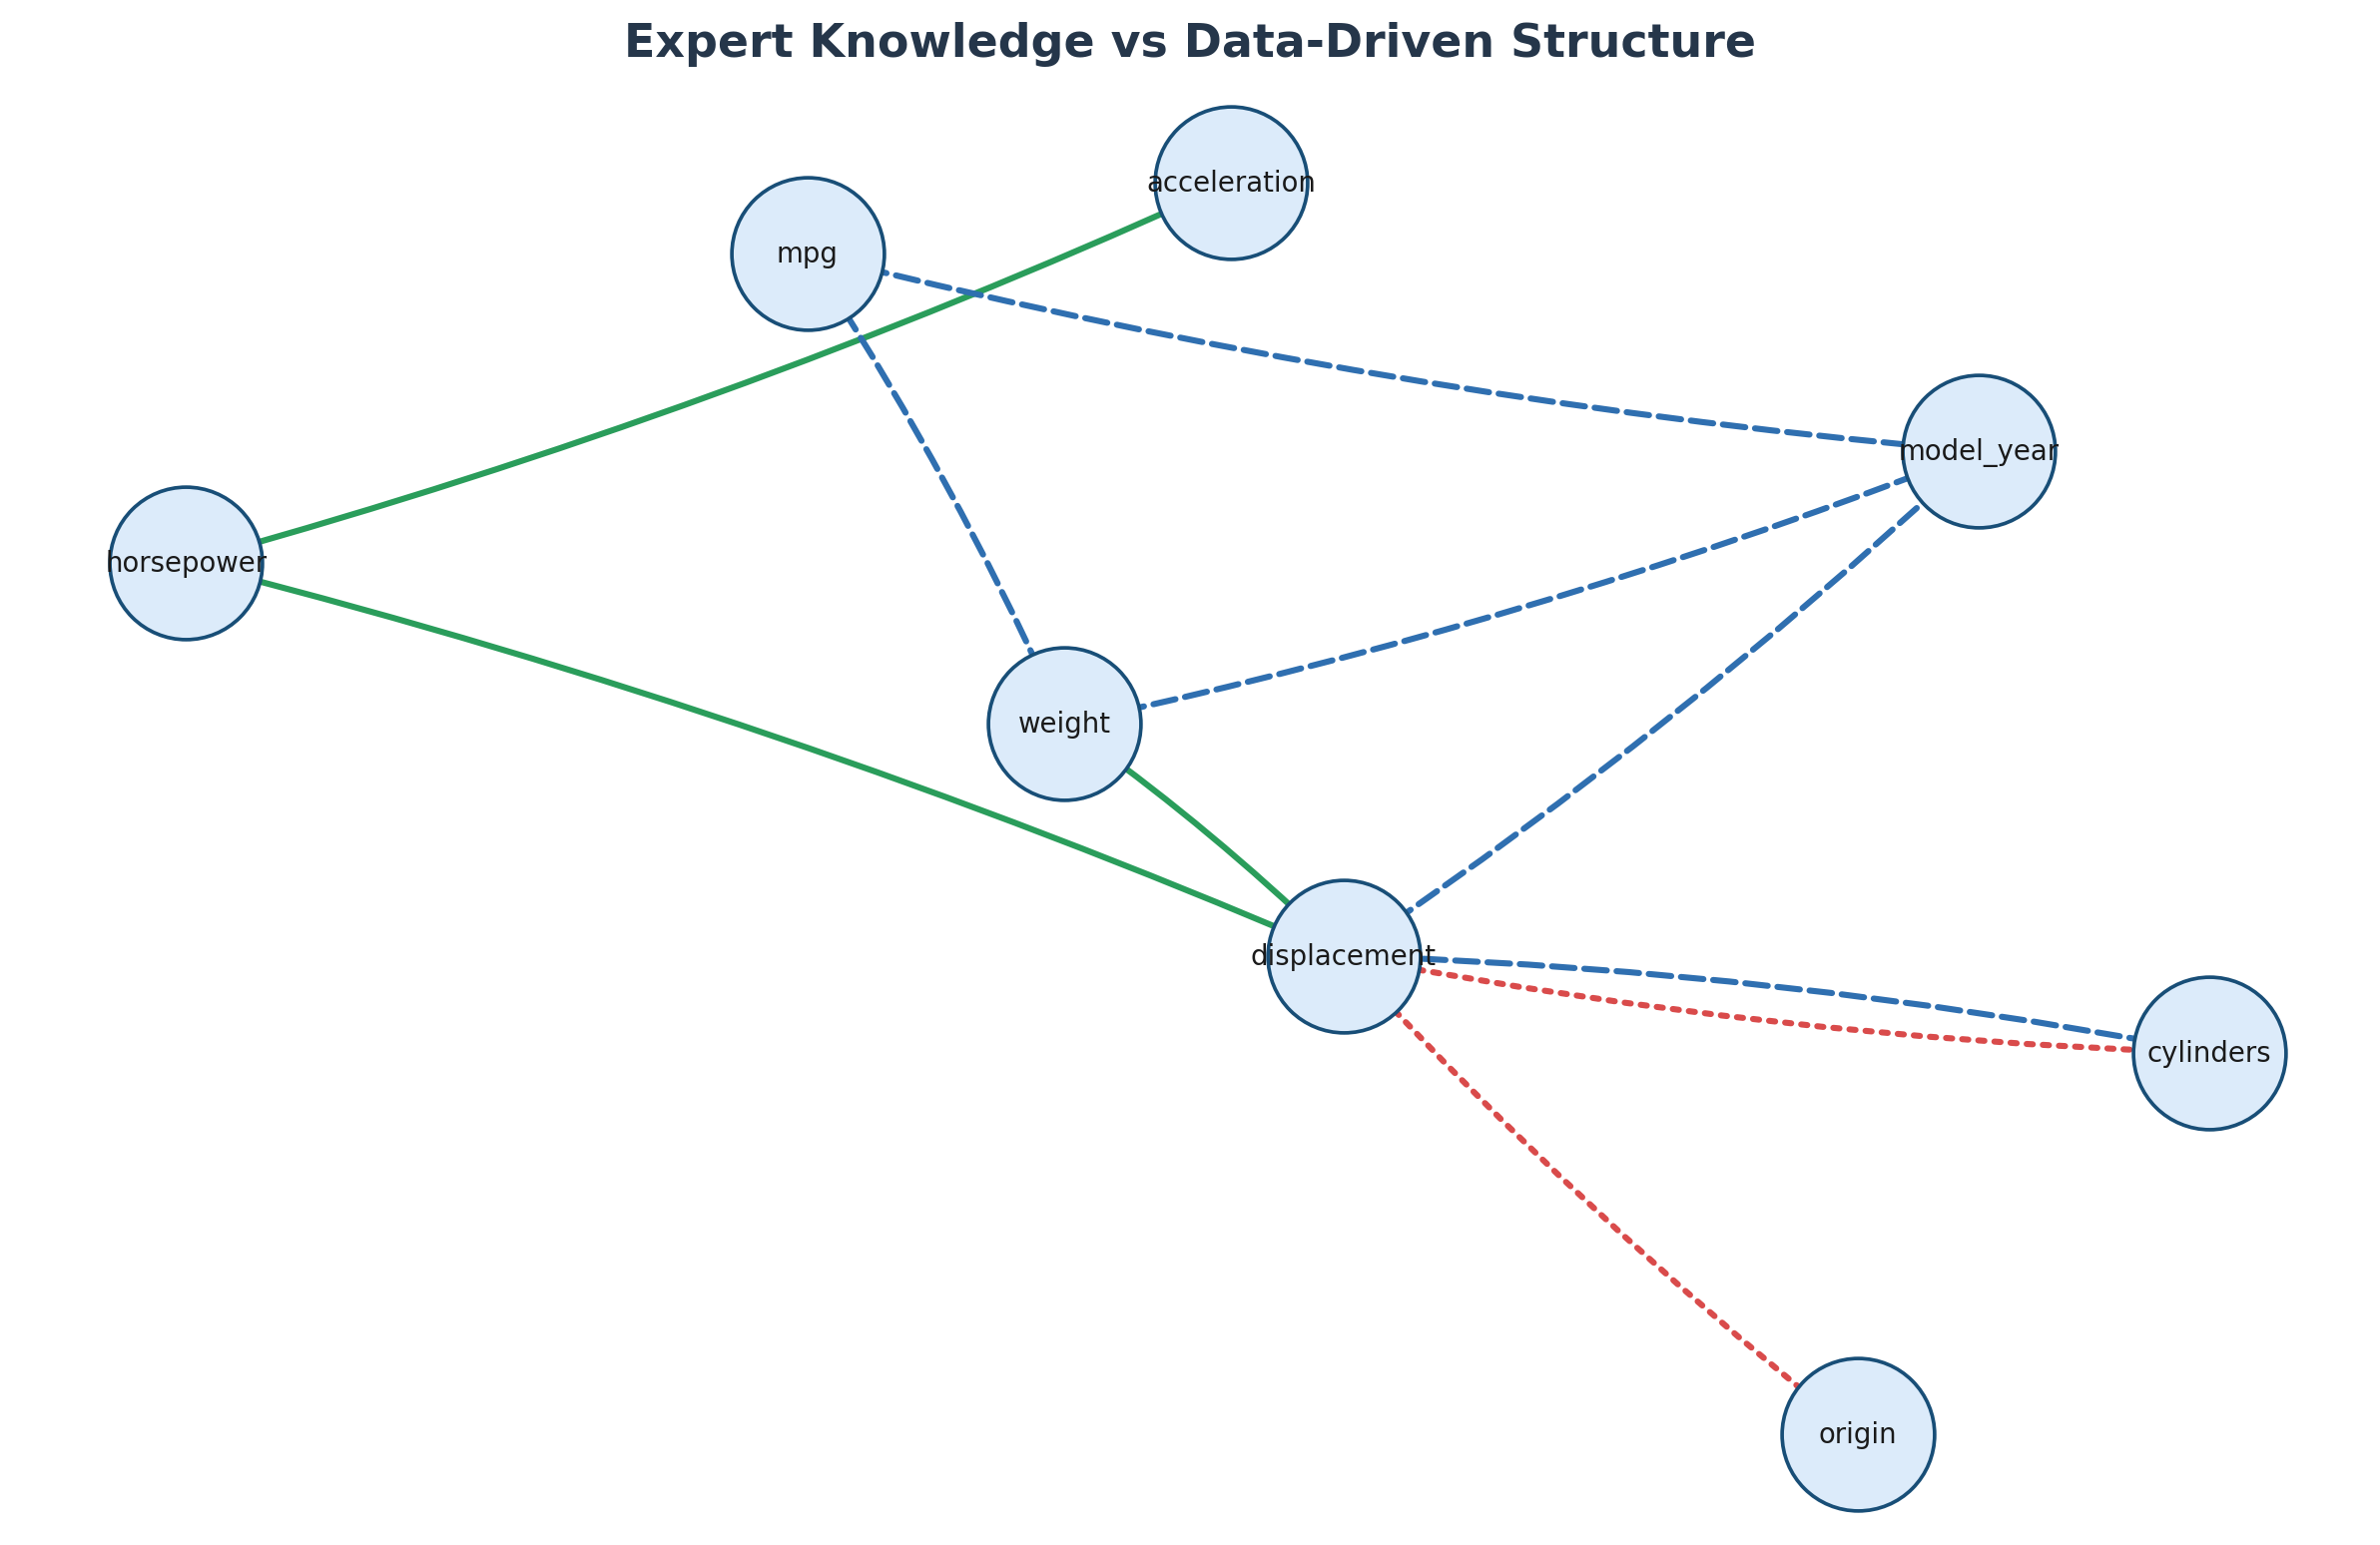
What it showsThree directed edges were shared: displacement to weight, displacement to horsepower, and horsepower to acceleration. The remaining five expert edges and two learned edges did not match exactly.
Why it mattersThe comparison reveals where domain reasoning and empirical conditional dependence agree. It also identifies relationships that require closer review rather than treating one graph as automatically authoritative.
LimitationA different edge direction can represent a similar set of conditional independencies within a Markov-equivalence class. Directional disagreement is not, by itself, proof that a relationship is absent.
03 · Edge agreement and pruning
The learned graph was smaller and did not retain a direct MPG edge
Independence testing removed the learned weight-to-MPG edge, leaving five supported relationships in the pruned graph.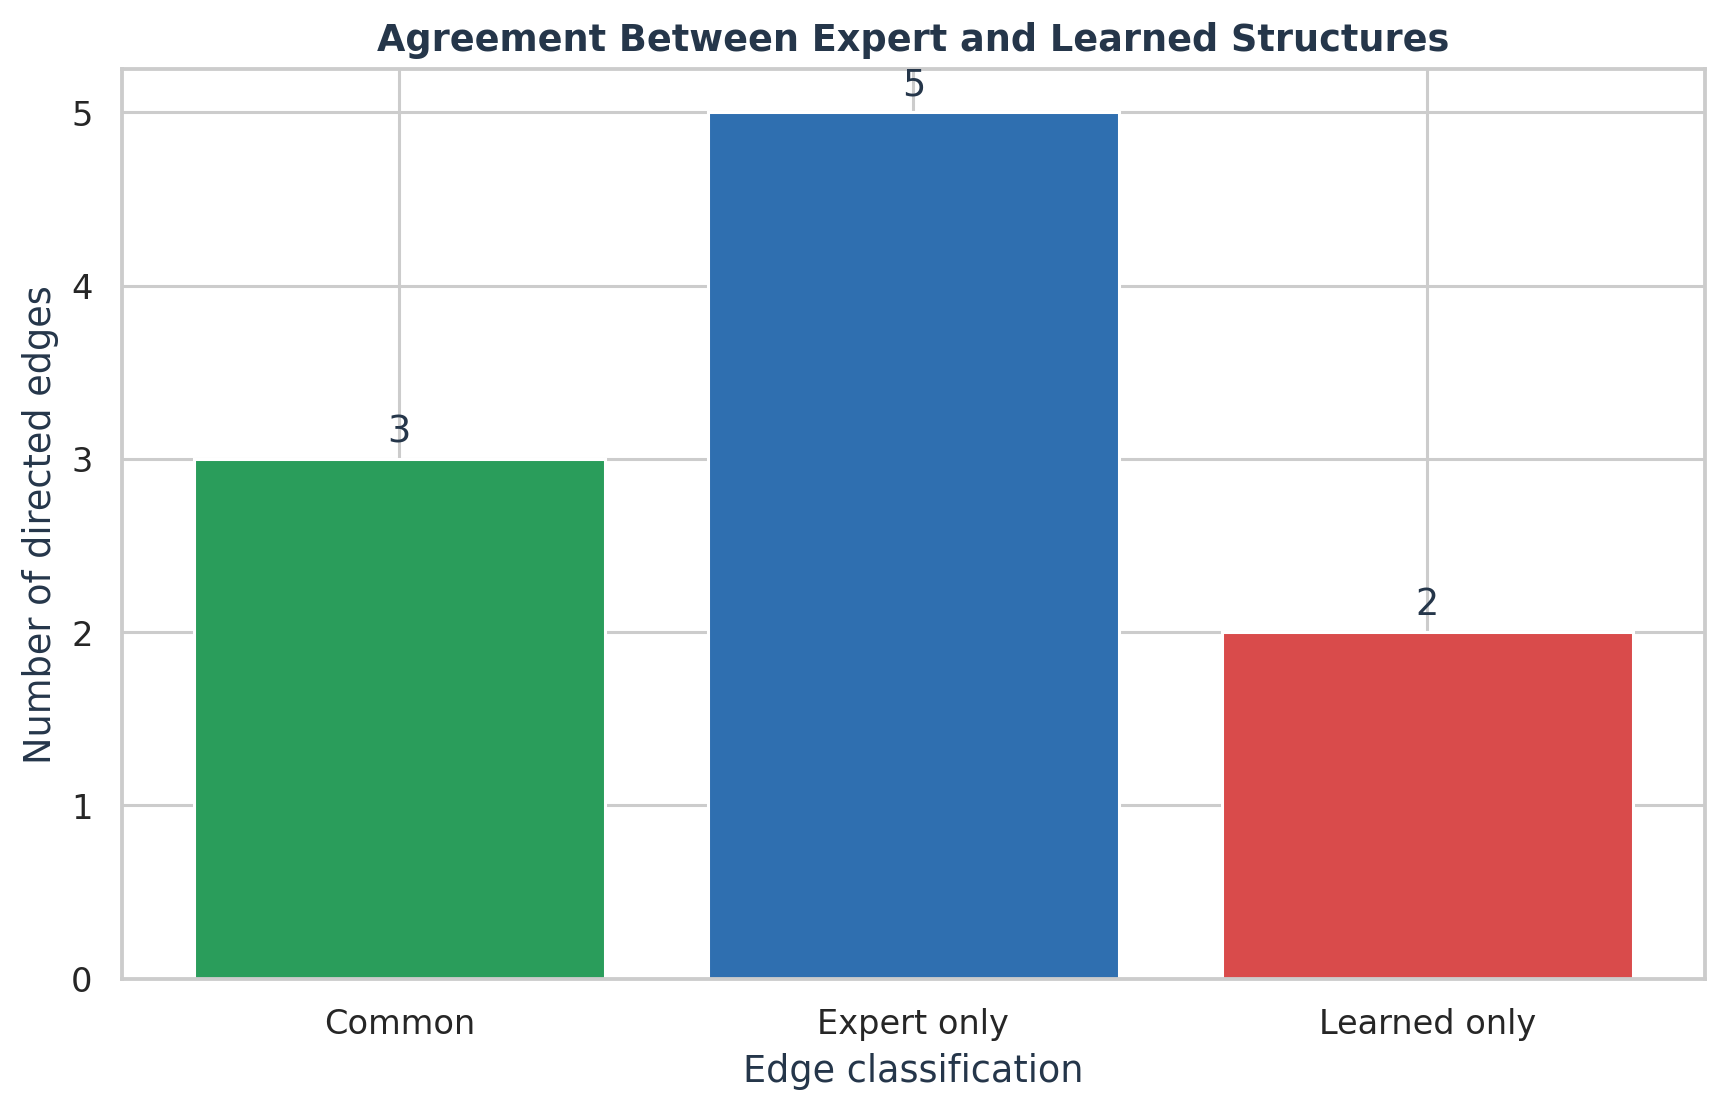
| Relationship | Status | Reading |
|---|---|---|
| Displacement to weight | Common | Expert and learned graphs agree |
| Displacement to horsepower | Common | Expert and learned graphs agree |
| Horsepower to acceleration | Common | Expert and learned graphs agree |
| Displacement to origin | Learned only | Selected from the observed dependencies |
| Weight to MPG | Expert only | Present in the expert parameter model |
What it showsHill climbing first selected six directed edges. After pruning, displacement remained connected to cylinders, weight, horsepower and origin, while horsepower remained connected to acceleration. All five retained pairs rejected independence at the selected rule.
Why it mattersPruning prevents every search-selected edge from being treated as equally supported. The final data-driven graph is therefore more compact than both the initial learned structure and the expert graph.
LimitationThe result depends on the hill-climbing search, BIC score and pruning threshold. The expert structure was used for the parameter-learning and MPG-inference stage, so these graphs answer different parts of the analysis.
04 · Posterior inference
A 3,000-pound vehicle produced a broad MPG probability distribution
The conditional probability tables were queried using the weight interval containing 3,000 pounds.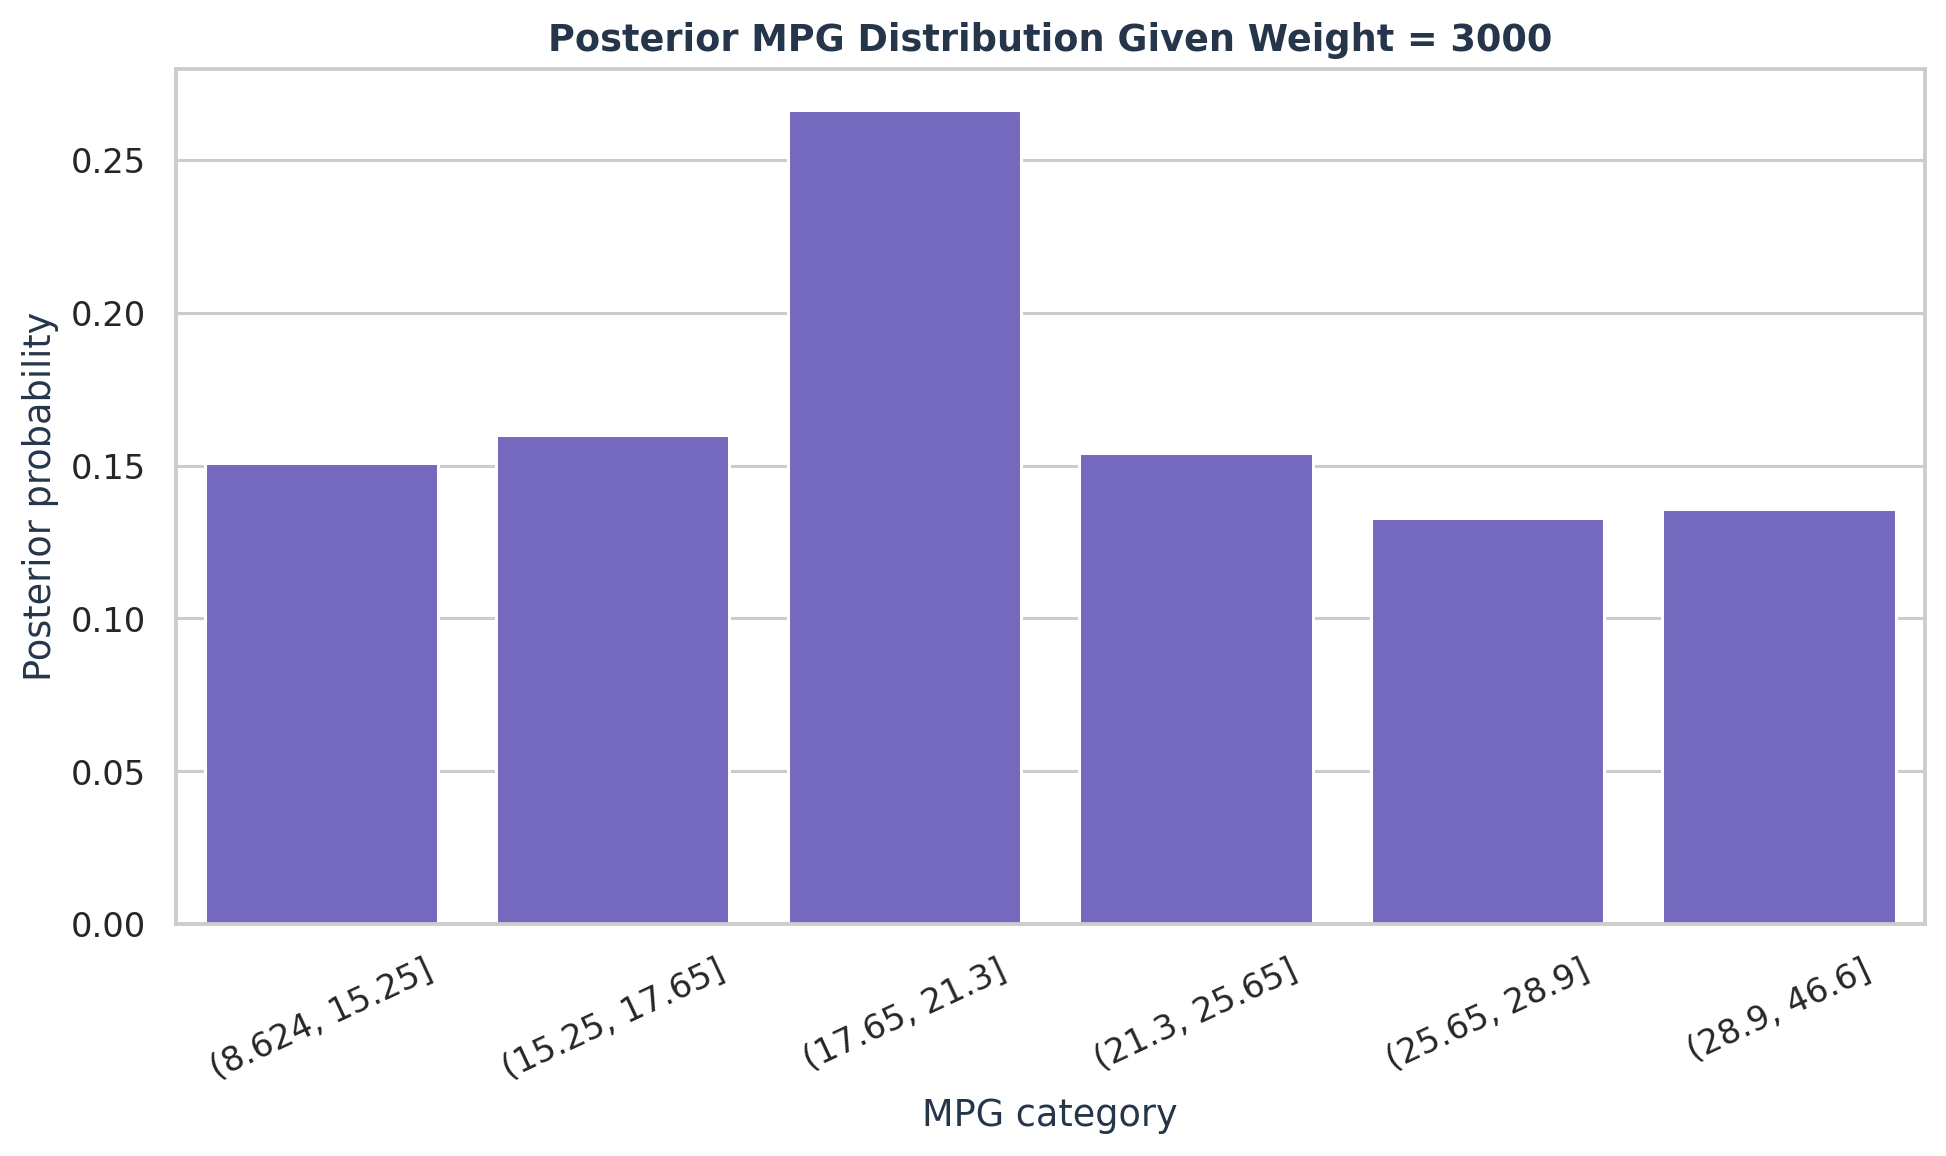
| MPG category | Posterior probability | Rank |
|---|---|---|
| 17.65 to 21.3 | 26.65% | 1 |
| 15.25 to 17.65 | 16.01% | 2 |
| 21.3 to 25.65 | 15.40% | 3 |
| 8.624 to 15.25 | 15.10% | 4 |
| 28.9 to 46.6 | 13.58% | 5 |
| 25.65 to 28.9 | 13.27% | 6 |
What it showsThe 17.65 to 21.3 MPG category had the largest posterior probability at 26.65%. Every other category retained between 13.27% and 16.01% probability.
Why it mattersBayesian inference preserves uncertainty. The network does not only return a class label; it shows how strongly each MPG range remains plausible under the supplied evidence.
LimitationThis is one illustrative evidence query based on discretised weight. It should not be interpreted as a calibrated prediction for every vehicle weighing 3,000 pounds.
05 · Fitted-model performance
Accuracy was moderate, while macro metrics exposed uneven class performance
The fitted network used weight, horsepower and displacement as evidence for MPG-category classification.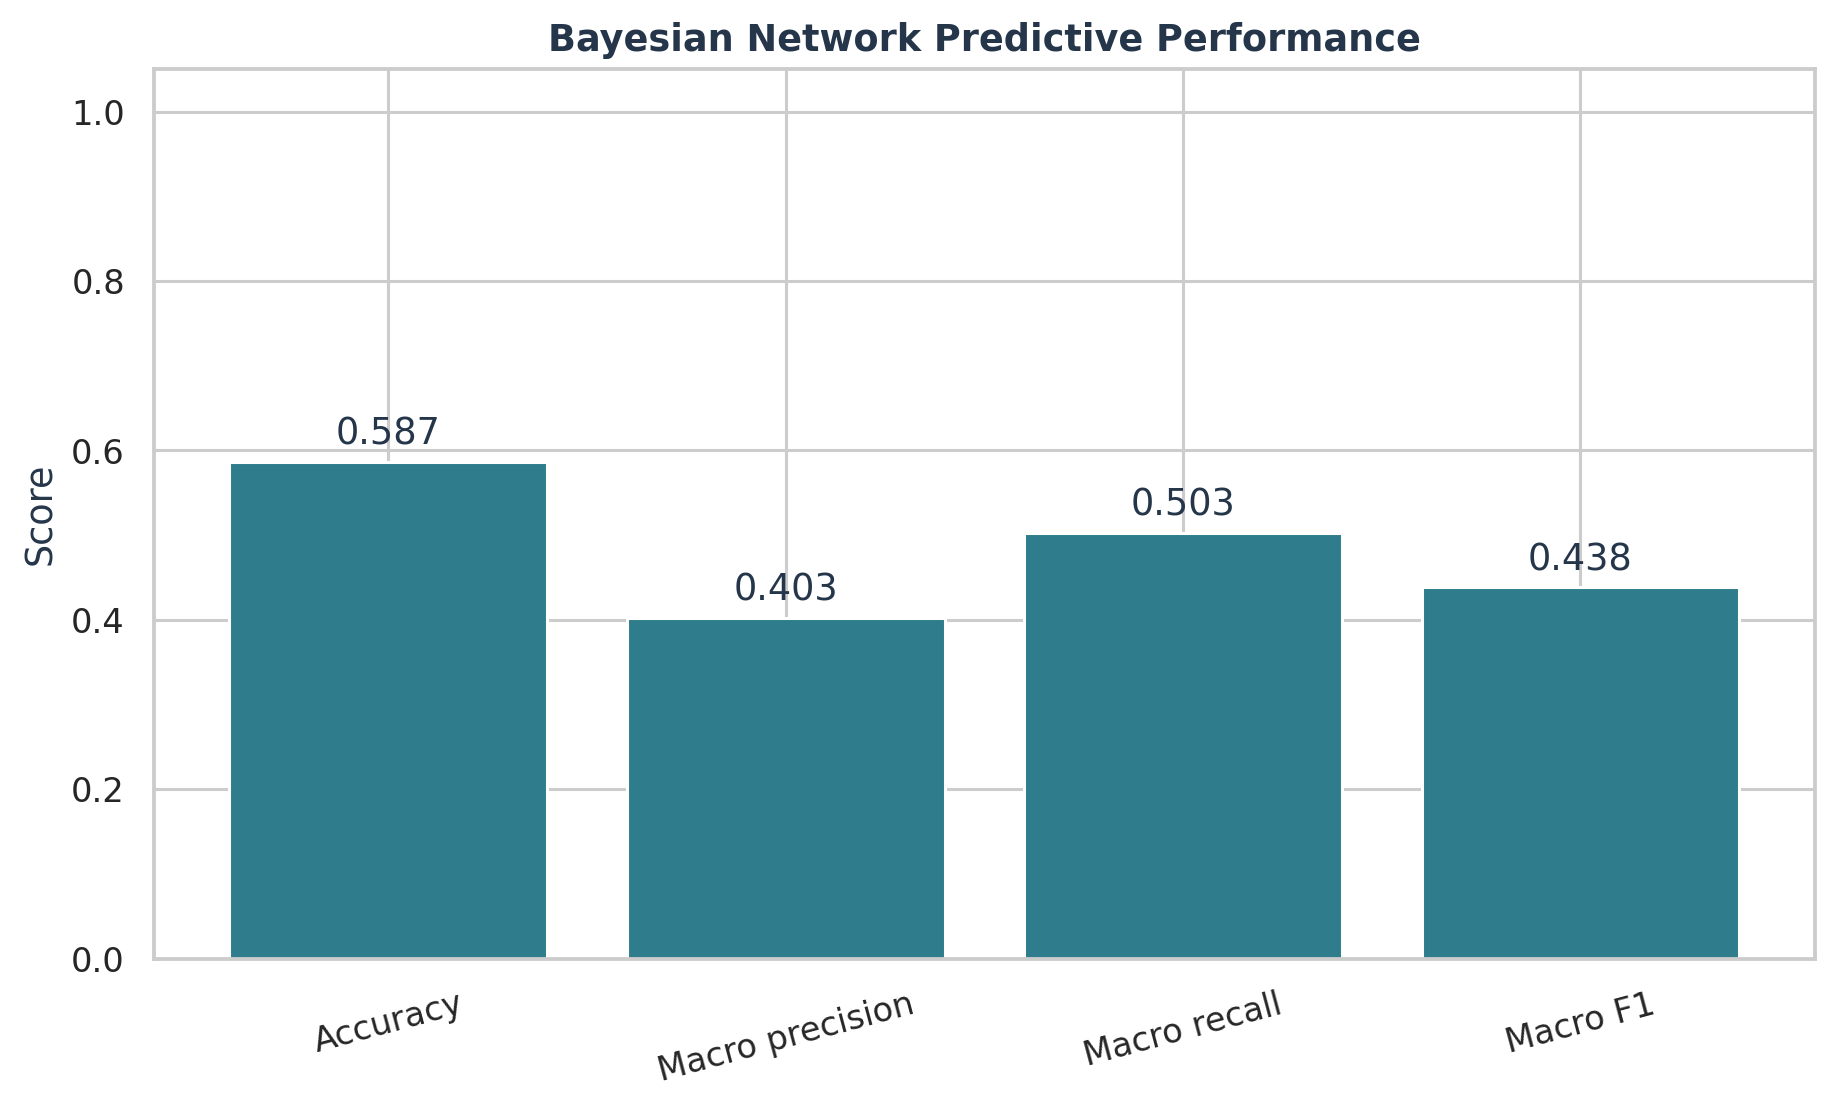
| Metric | Result | What it captures |
|---|---|---|
| Accuracy | 58.67% | Overall correct classifications |
| Macro precision | 40.28% | Average class-level positive predictive value |
| Macro recall | 50.28% | Average class-level sensitivity |
| Macro F1 | 43.84% | Balanced class-level precision and recall |
What it showsThe network reproduced 58.67% of observed MPG categories. Macro precision was 40.28%, macro recall was 50.28%, and macro F1 was 43.84%.
Why it mattersMacro averaging gives every MPG category equal weight. The gap between overall accuracy and macro F1 shows that the model performed much better for some categories than others.
LimitationThese metrics are in-sample. The same 392 records informed parameter estimation and evaluation, so the scores do not estimate performance on unseen vehicles.
06 · Classification errors
Two MPG categories were never selected as predictions
The confusion matrix explains why the macro scores remained below the overall accuracy.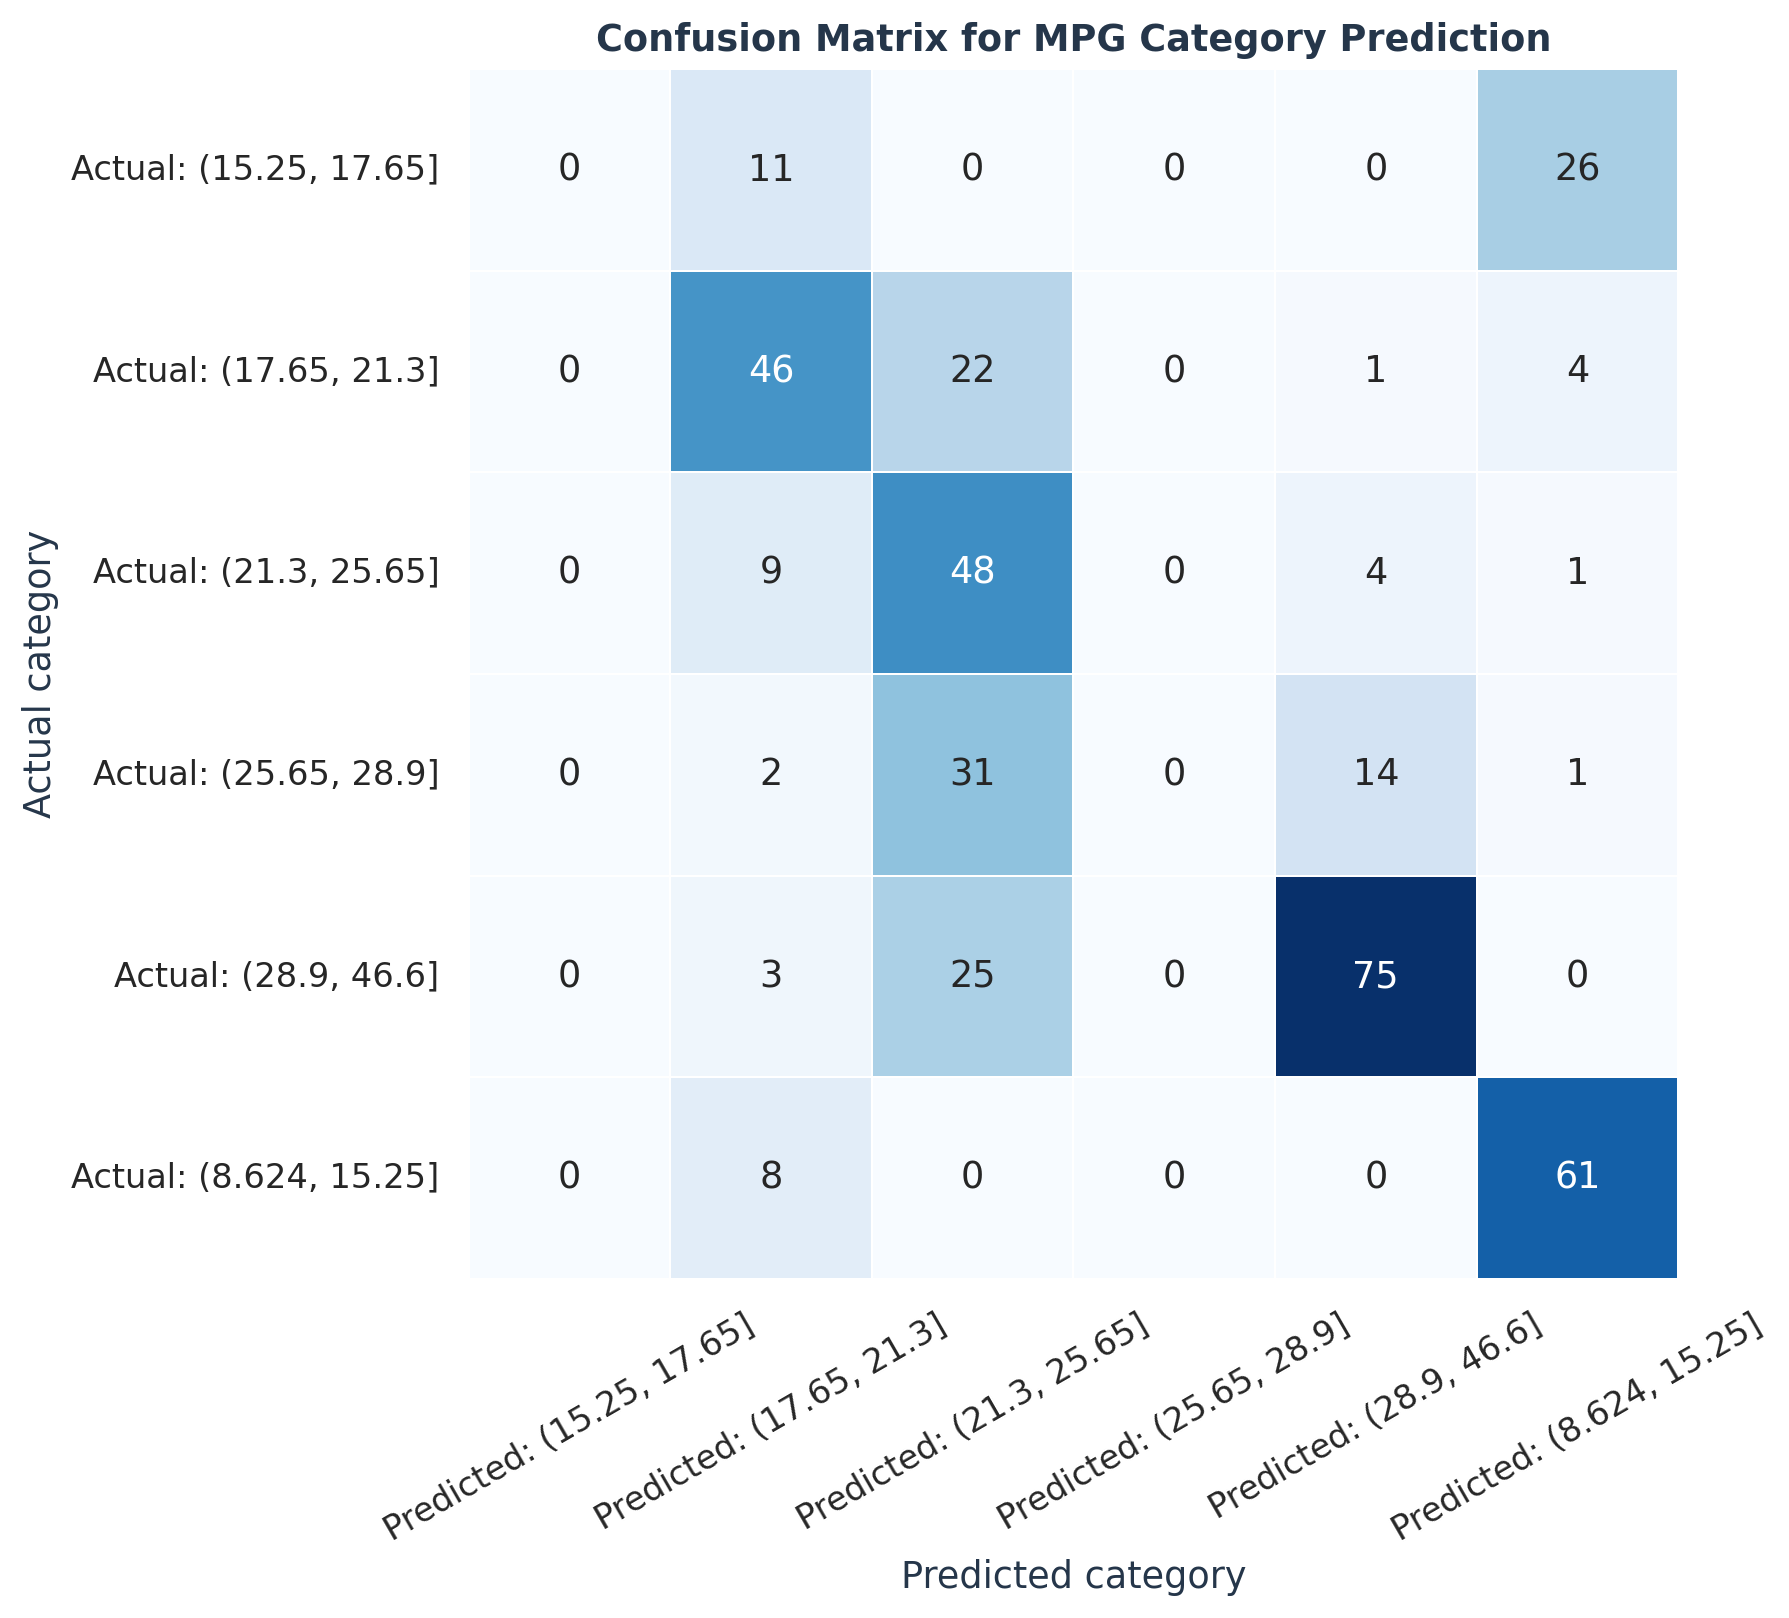
| MPG category | Precision | Recall | F1 |
|---|---|---|---|
| 8.624 to 15.25 | 65.59% | 88.41% | 75.31% |
| 17.65 to 21.3 | 58.23% | 63.01% | 60.53% |
| 21.3 to 25.65 | 38.10% | 77.42% | 51.06% |
| 28.9 to 46.6 | 79.79% | 72.82% | 76.14% |
| 15.25 to 17.65 | 0.00% | 0.00% | 0.00% |
| 25.65 to 28.9 | 0.00% | 0.00% | 0.00% |
What it showsThe model predicted zero vehicles in the 15.25 to 17.65 and 25.65 to 28.9 MPG categories. Recall was strongest for the lowest MPG group at 88.41%, followed by the 21.3 to 25.65 group at 77.42% and the highest MPG group at 72.82%.
Why it mattersA model can reach moderate accuracy by concentrating predictions in a subset of classes. The missing categories make the current hard classifications unsuitable for claims of balanced multiclass performance.
LimitationOut-of-sample validation, probability calibration and alternative class boundaries are required before deciding whether the error pattern is stable.
Expert knowledge and structure learning
The expert graph contained eight directed edges. Hill climbing initially selected six edges, and independence testing reduced the learned graph to five. Three directed relationships appeared in both structures: displacement to weight, displacement to horsepower, and horsepower to acceleration.
The differences are informative rather than evidence that one graph is automatically correct. The learned model reversed the cylinders-displacement direction, added displacement to origin, and did not retain the expert model's direct weight-to-MPG relationship after pruning.
Probabilistic inference
The fitted conditional probability tables translate the network into a probabilistic model. For a vehicle weighing 3,000 pounds, the evidence falls in the 2,959.5 to 3,657.5 weight category. The largest posterior probability was 26.65% for the 17.65 to 21.3 MPG category.
The remaining probability was spread across all other MPG categories, with individual probabilities between 13.27% and 16.01%. The example therefore demonstrates uncertainty-aware inference rather than a single certain classification.
Classification result
Using weight, horsepower and displacement as evidence, the fitted network reproduced 58.67% of the 392 observed MPG categories. Macro precision was 40.28%, macro recall was 50.28%, and macro F1 was 43.84%.
Performance varied sharply across categories. The model classified the lowest and highest MPG groups comparatively well, yet it never predicted the 15.25 to 17.65 or 25.65 to 28.9 categories. This explains why accuracy alone gives an incomplete picture of model quality.
Interpretation and limitations
The prediction metrics are in-sample: the same 392 observations informed parameter learning and evaluation. They measure how well the fitted network reconstructs its training data, not how reliably it will classify unseen vehicles.
The learned edges describe conditional dependence and should not be interpreted as causal effects without additional assumptions. Results also depend on discretisation cut-points, hill-climbing search, BIC scoring, pruning rules and edge direction within potentially equivalent graph structures.
- Use a train-test split or cross-validation for a genuine generalisation estimate.
- Test alternative discretisation rules and compare structural stability.
- Report posterior probabilities alongside hard class predictions.
- Treat the graph as a dependency model unless causal identification is established.
People behind the project