

Central question
How strongly are multivariate patterns of computer fear and statistics fear related, and which questionnaire items define the relationship?
Project overview
This personal multivariate-analysis project examined the relationship between two sets of Likert-scale responses: seven items measuring fear of computers and eight items measuring fear of statistics. Canonical correlation analysis was appropriate since the question concerns the relationship between two variable systems rather than a single outcome.
The workflow moved from data screening and correlation checks to sequential significance testing, structure-coefficient interpretation, cross-loadings and redundancy. The analysis emphasises the functions that carry interpretable shared information instead of listing coefficients without context.
No missing selected items
Strongest variate-pair relationship
First canonical function
Sequential Wilks tests at 5%
Evidence summary
One strong shared fear dimension
Selected results from the complete CCA output show the size, significance, composition and practical explanatory value of the canonical functions.01 · Data audit
Every respondent entered the final analysis
The CCA used all 2,571 respondents and all 15 selected questionnaire items.| Measure | Result | Interpretation |
|---|---|---|
| Respondents | 2,571 | All retained |
| Computer-fear items | 7 | Q06, Q18, Q13, Q07, Q14, Q10, Q15 |
| Statistics-fear items | 8 | Q20, Q21, Q03, Q12, Q04, Q16, Q01, Q05 |
| Missing selected cells | 0 | No complete-case loss |
What it showsThe source contained 23 variables, of which seven computer-fear and eight statistics-fear items were selected. No selected-item values were missing, so no complete cases were lost.
Why it mattersThe canonical functions describe the full available sample rather than a smaller subset created by missing-data deletion.
LimitationThe responses use five-point Likert items. CCA treats the item scores as approximately continuous and captures linear relationships between weighted composites.
02 · Canonical functions
Function 1 carried most of the relationship
The first canonical correlation stood apart from the remaining six functions.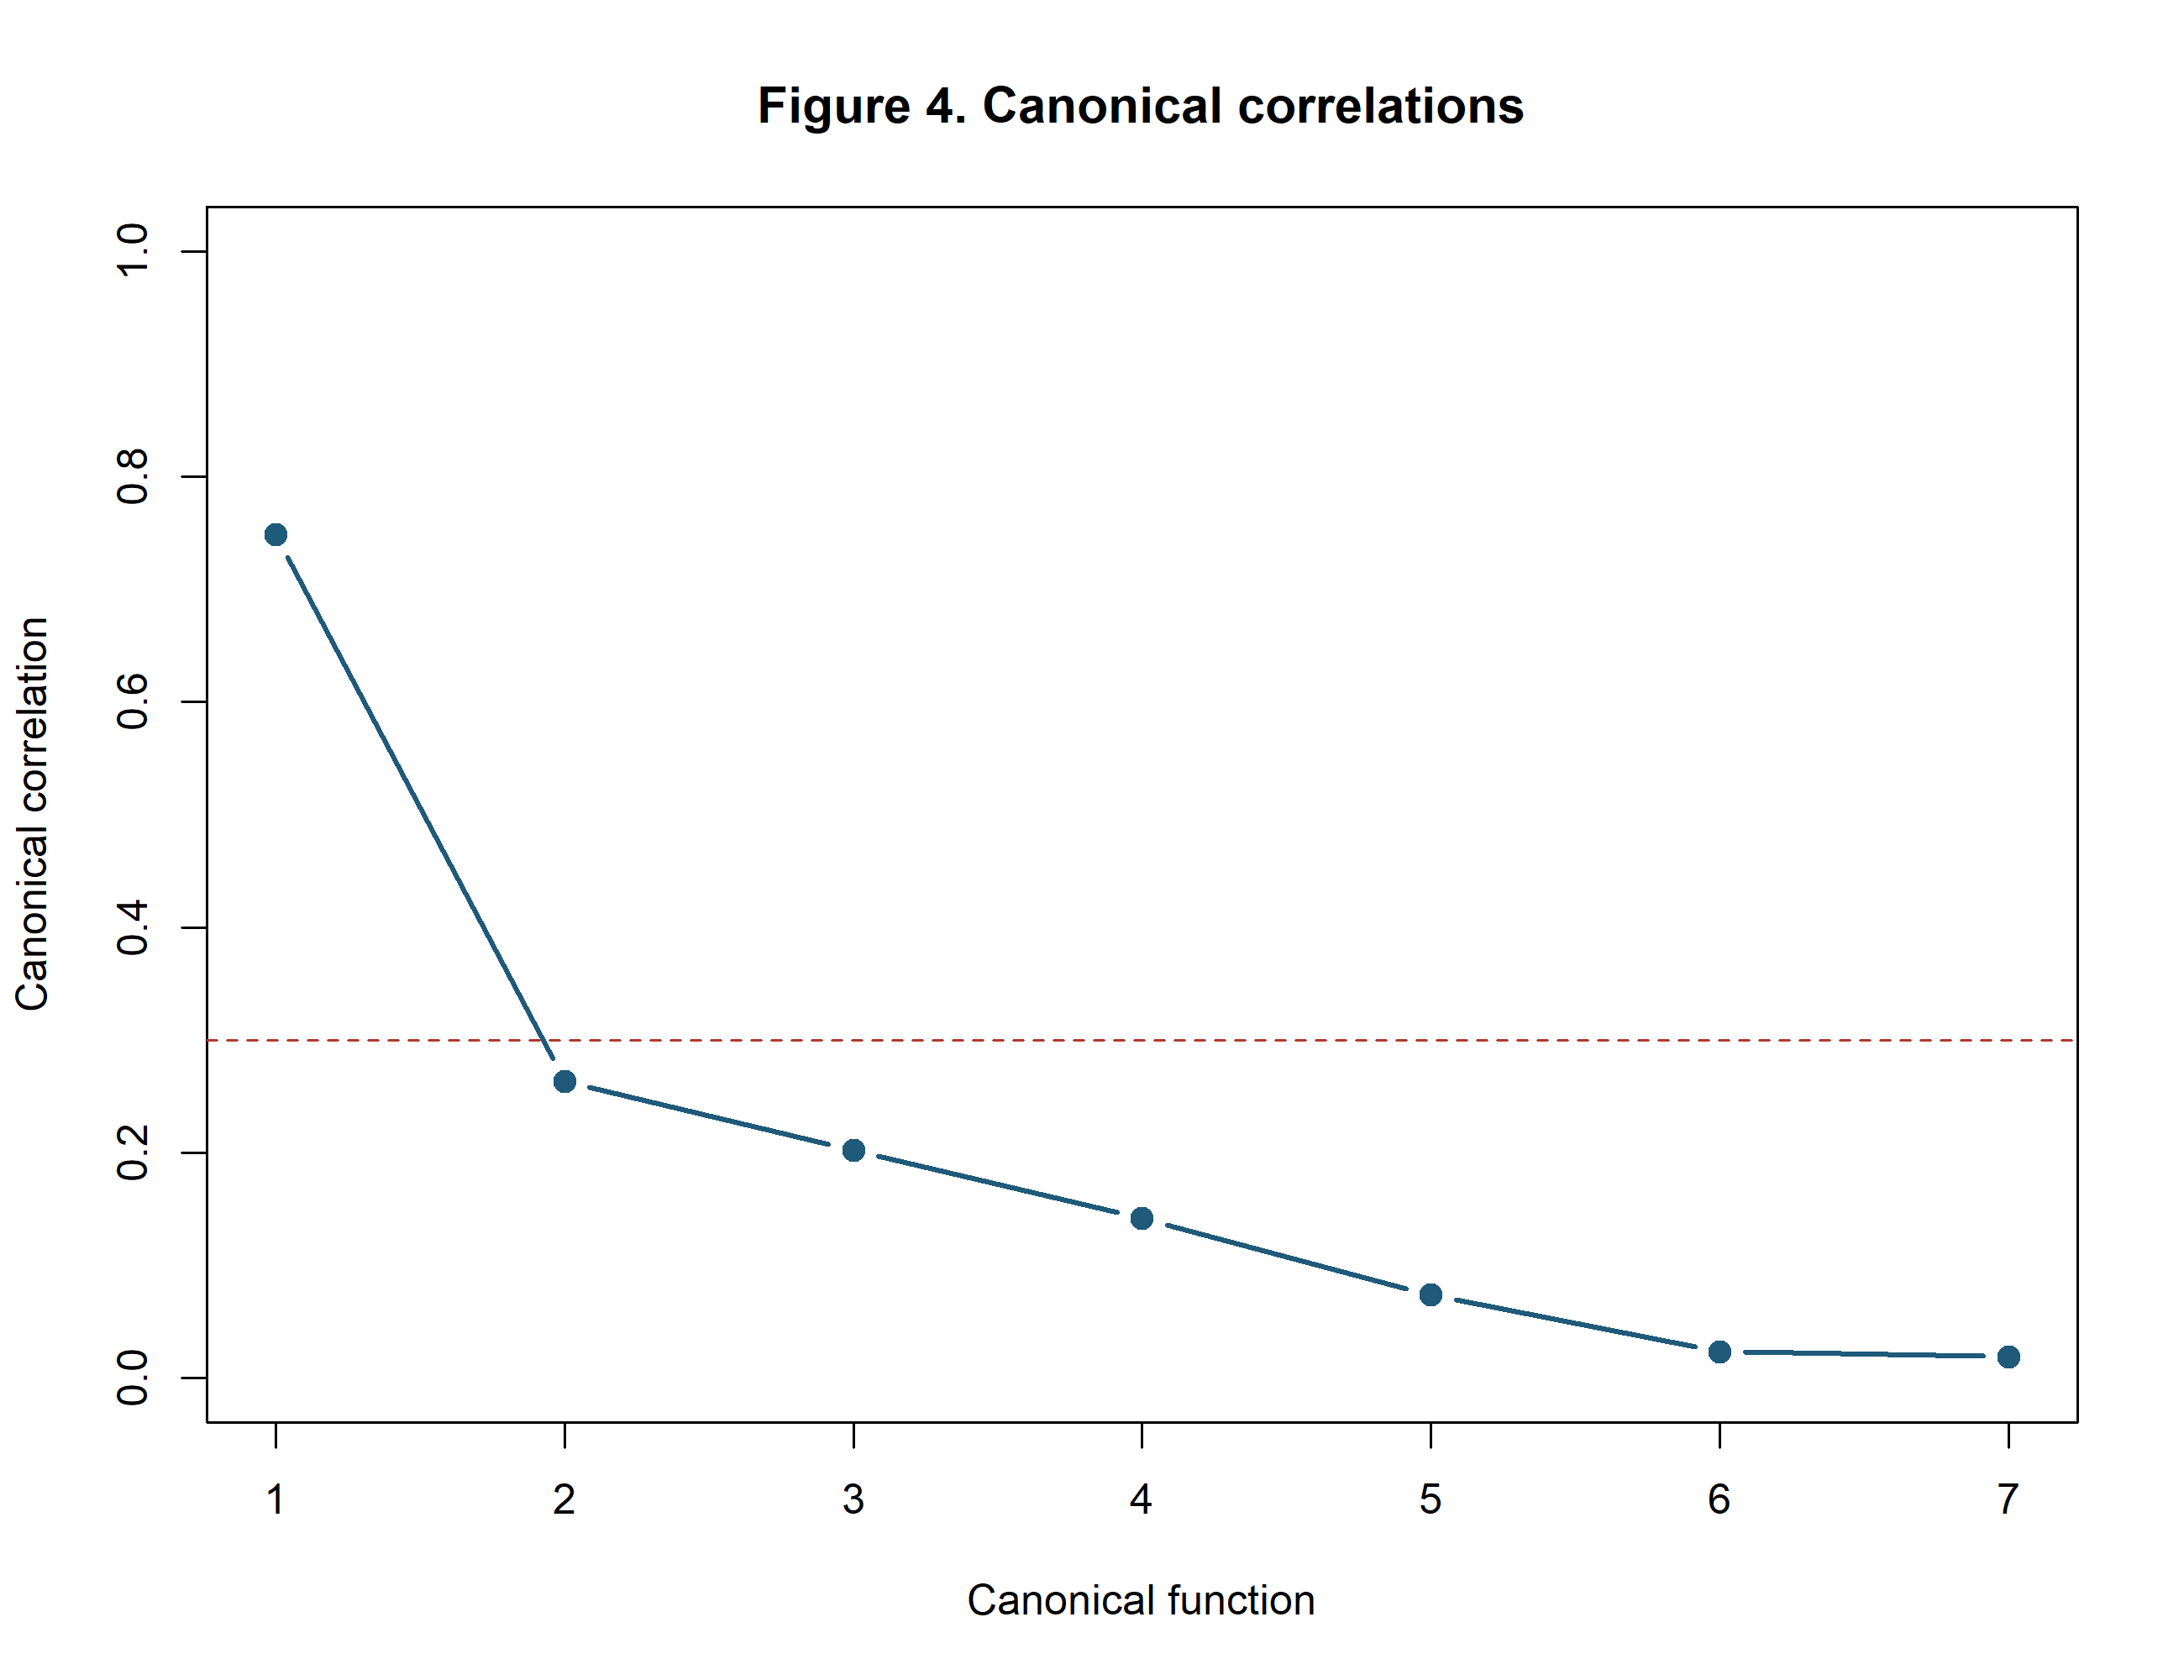
| Functions tested | Canonical r | Shared variance | Wilks' p | Retain |
|---|---|---|---|---|
| 1-7 | 0.748 | 56.01% | < .001 | Yes |
| 2-7 | 0.263 | 6.93% | < .001 | Yes |
| 3-7 | 0.202 | 4.07% | < .001 | Yes |
| 4-7 | 0.141 | 2.00% | < .001 | Yes |
| 5-7 | 0.074 | 0.54% | .184 | No |
| 6-7 | 0.023 | 0.05% | .893 | No |
| 7 | 0.019 | 0.03% | .643 | No |
What it showsFunction 1 produced r = 0.748 and 56.0% shared variance. Functions 2-4 were statistically significant, yet their shared variances fell to 6.93%, 4.07% and 2.00%.
Why it mattersThe relationship between the two item sets is best understood as one dominant common dimension followed by much smaller residual patterns.
LimitationSequential significance tests are sensitive to sample size. With 2,571 respondents, statistical significance does not guarantee that a later function is practically important.
03 · Structure coefficients
The first variates were broadly defined across both item sets
Structure correlations show which observed items most clearly represent each canonical variate.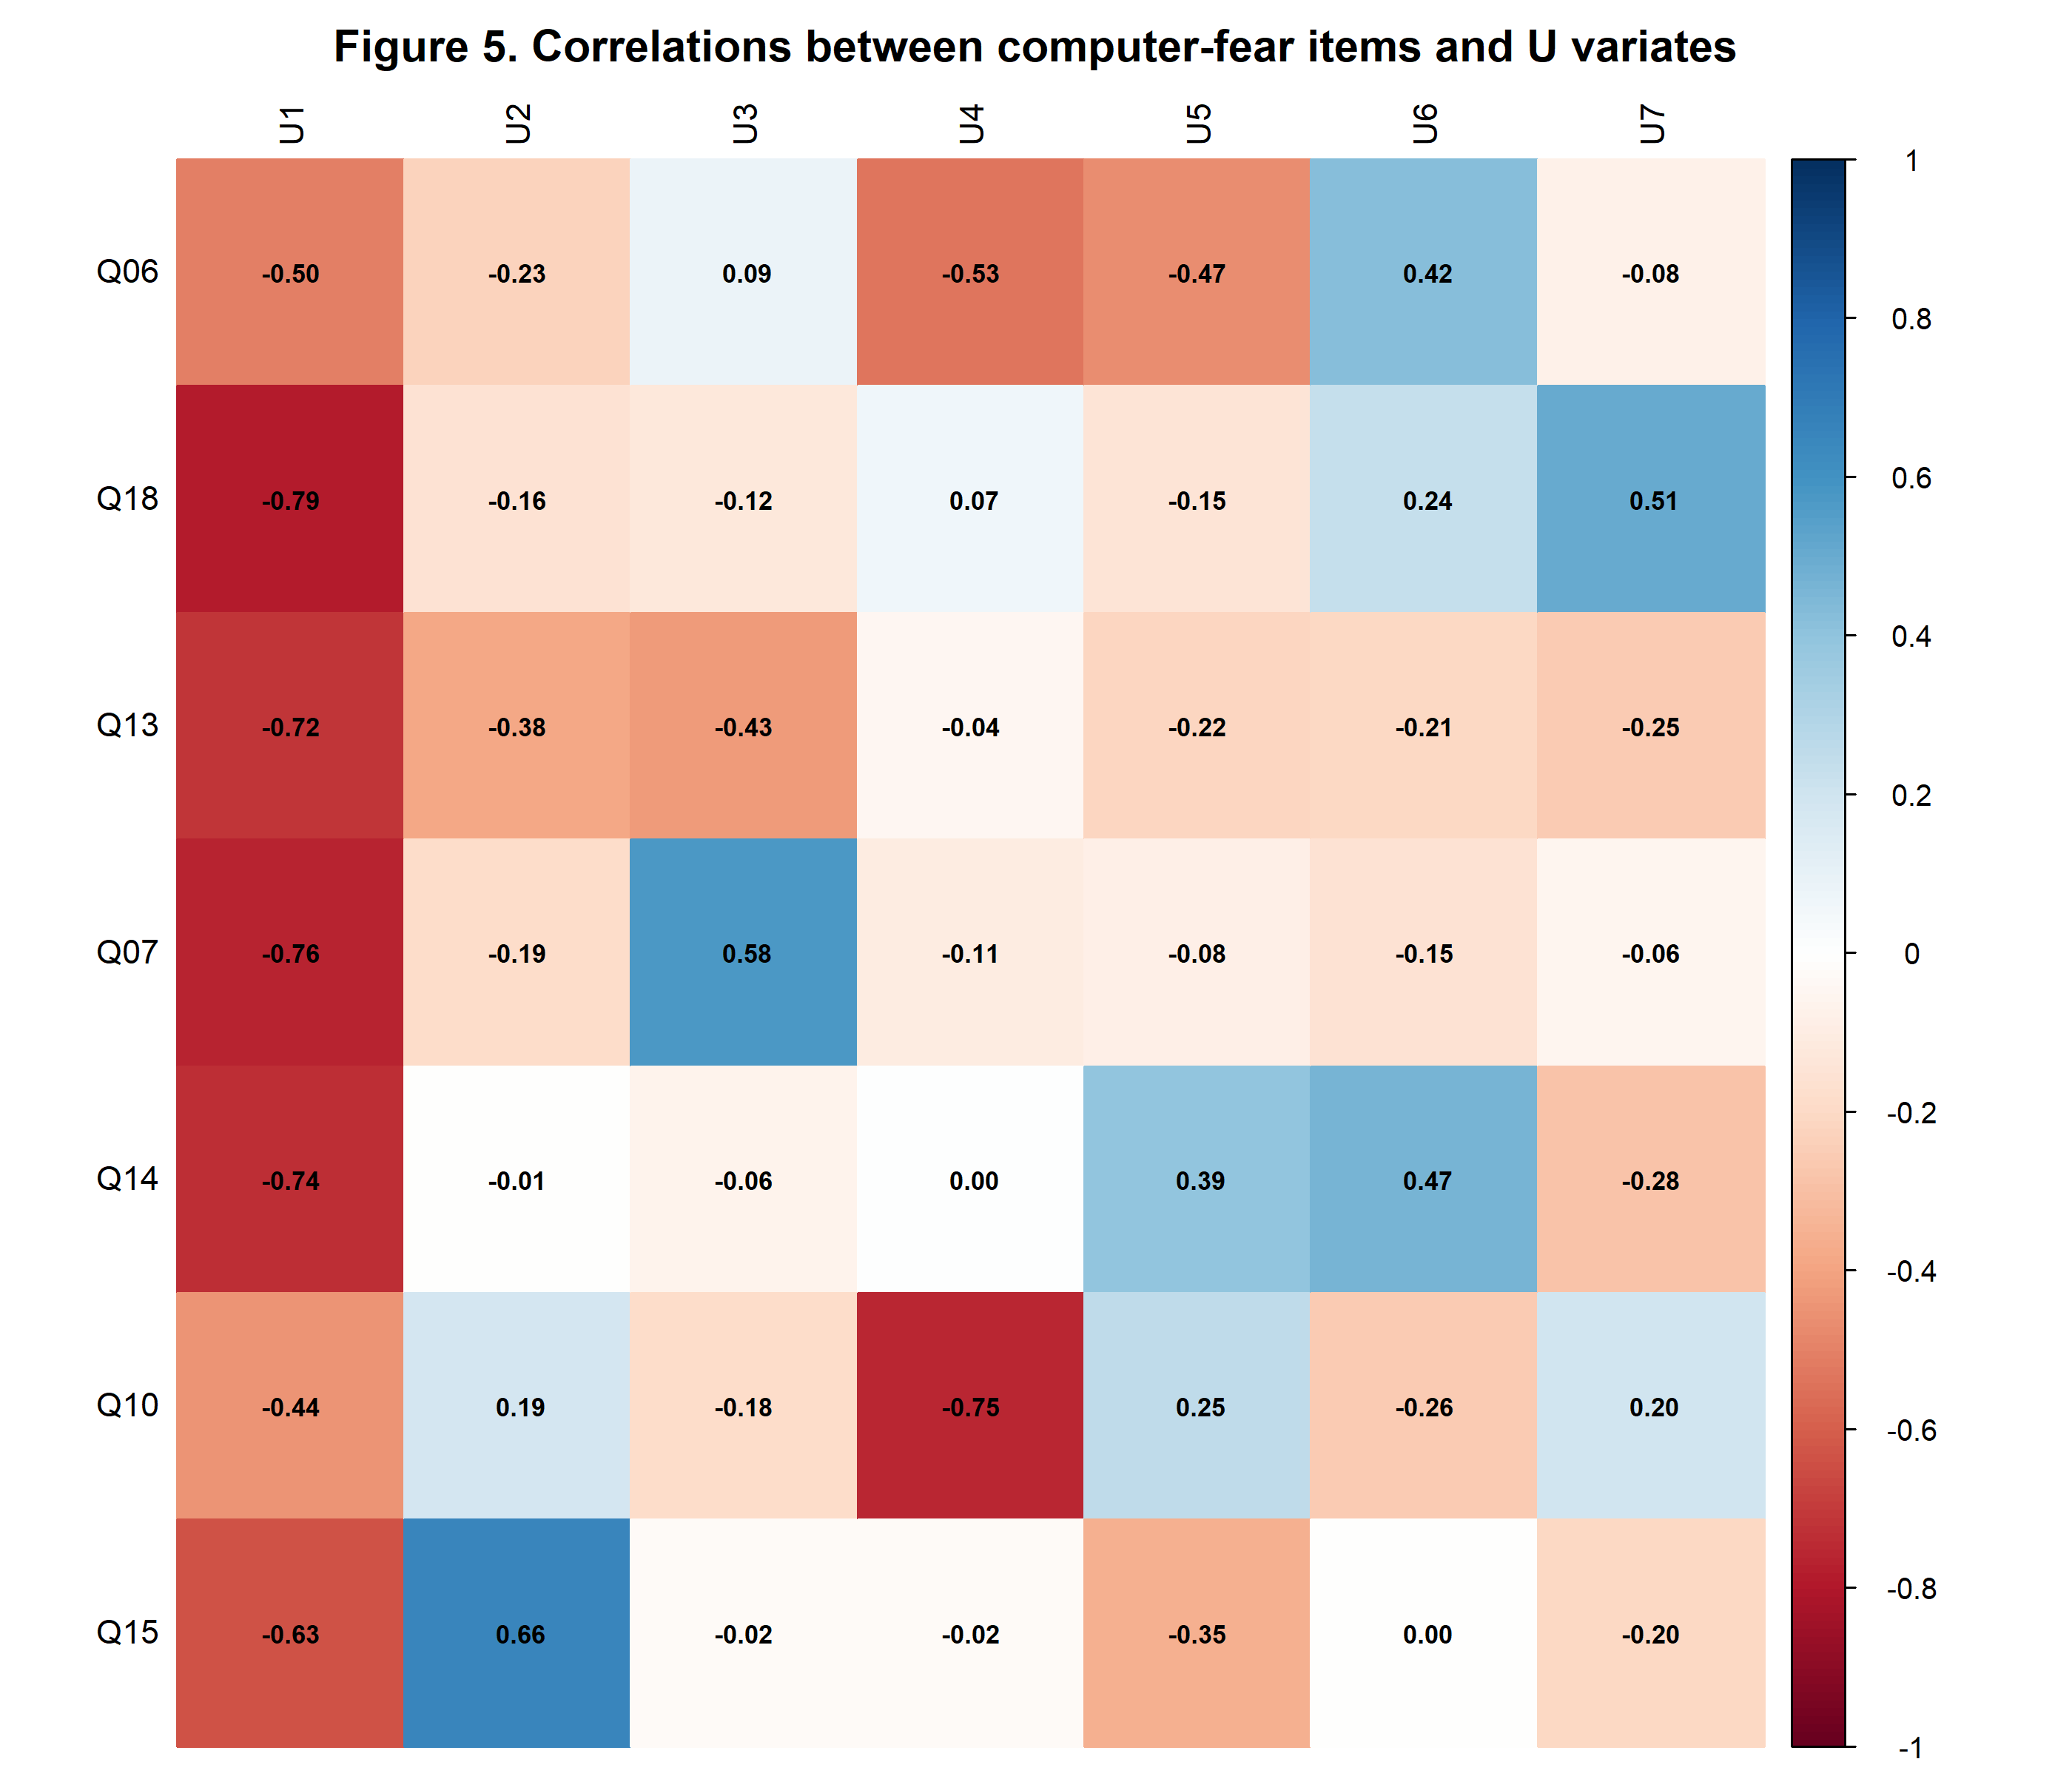
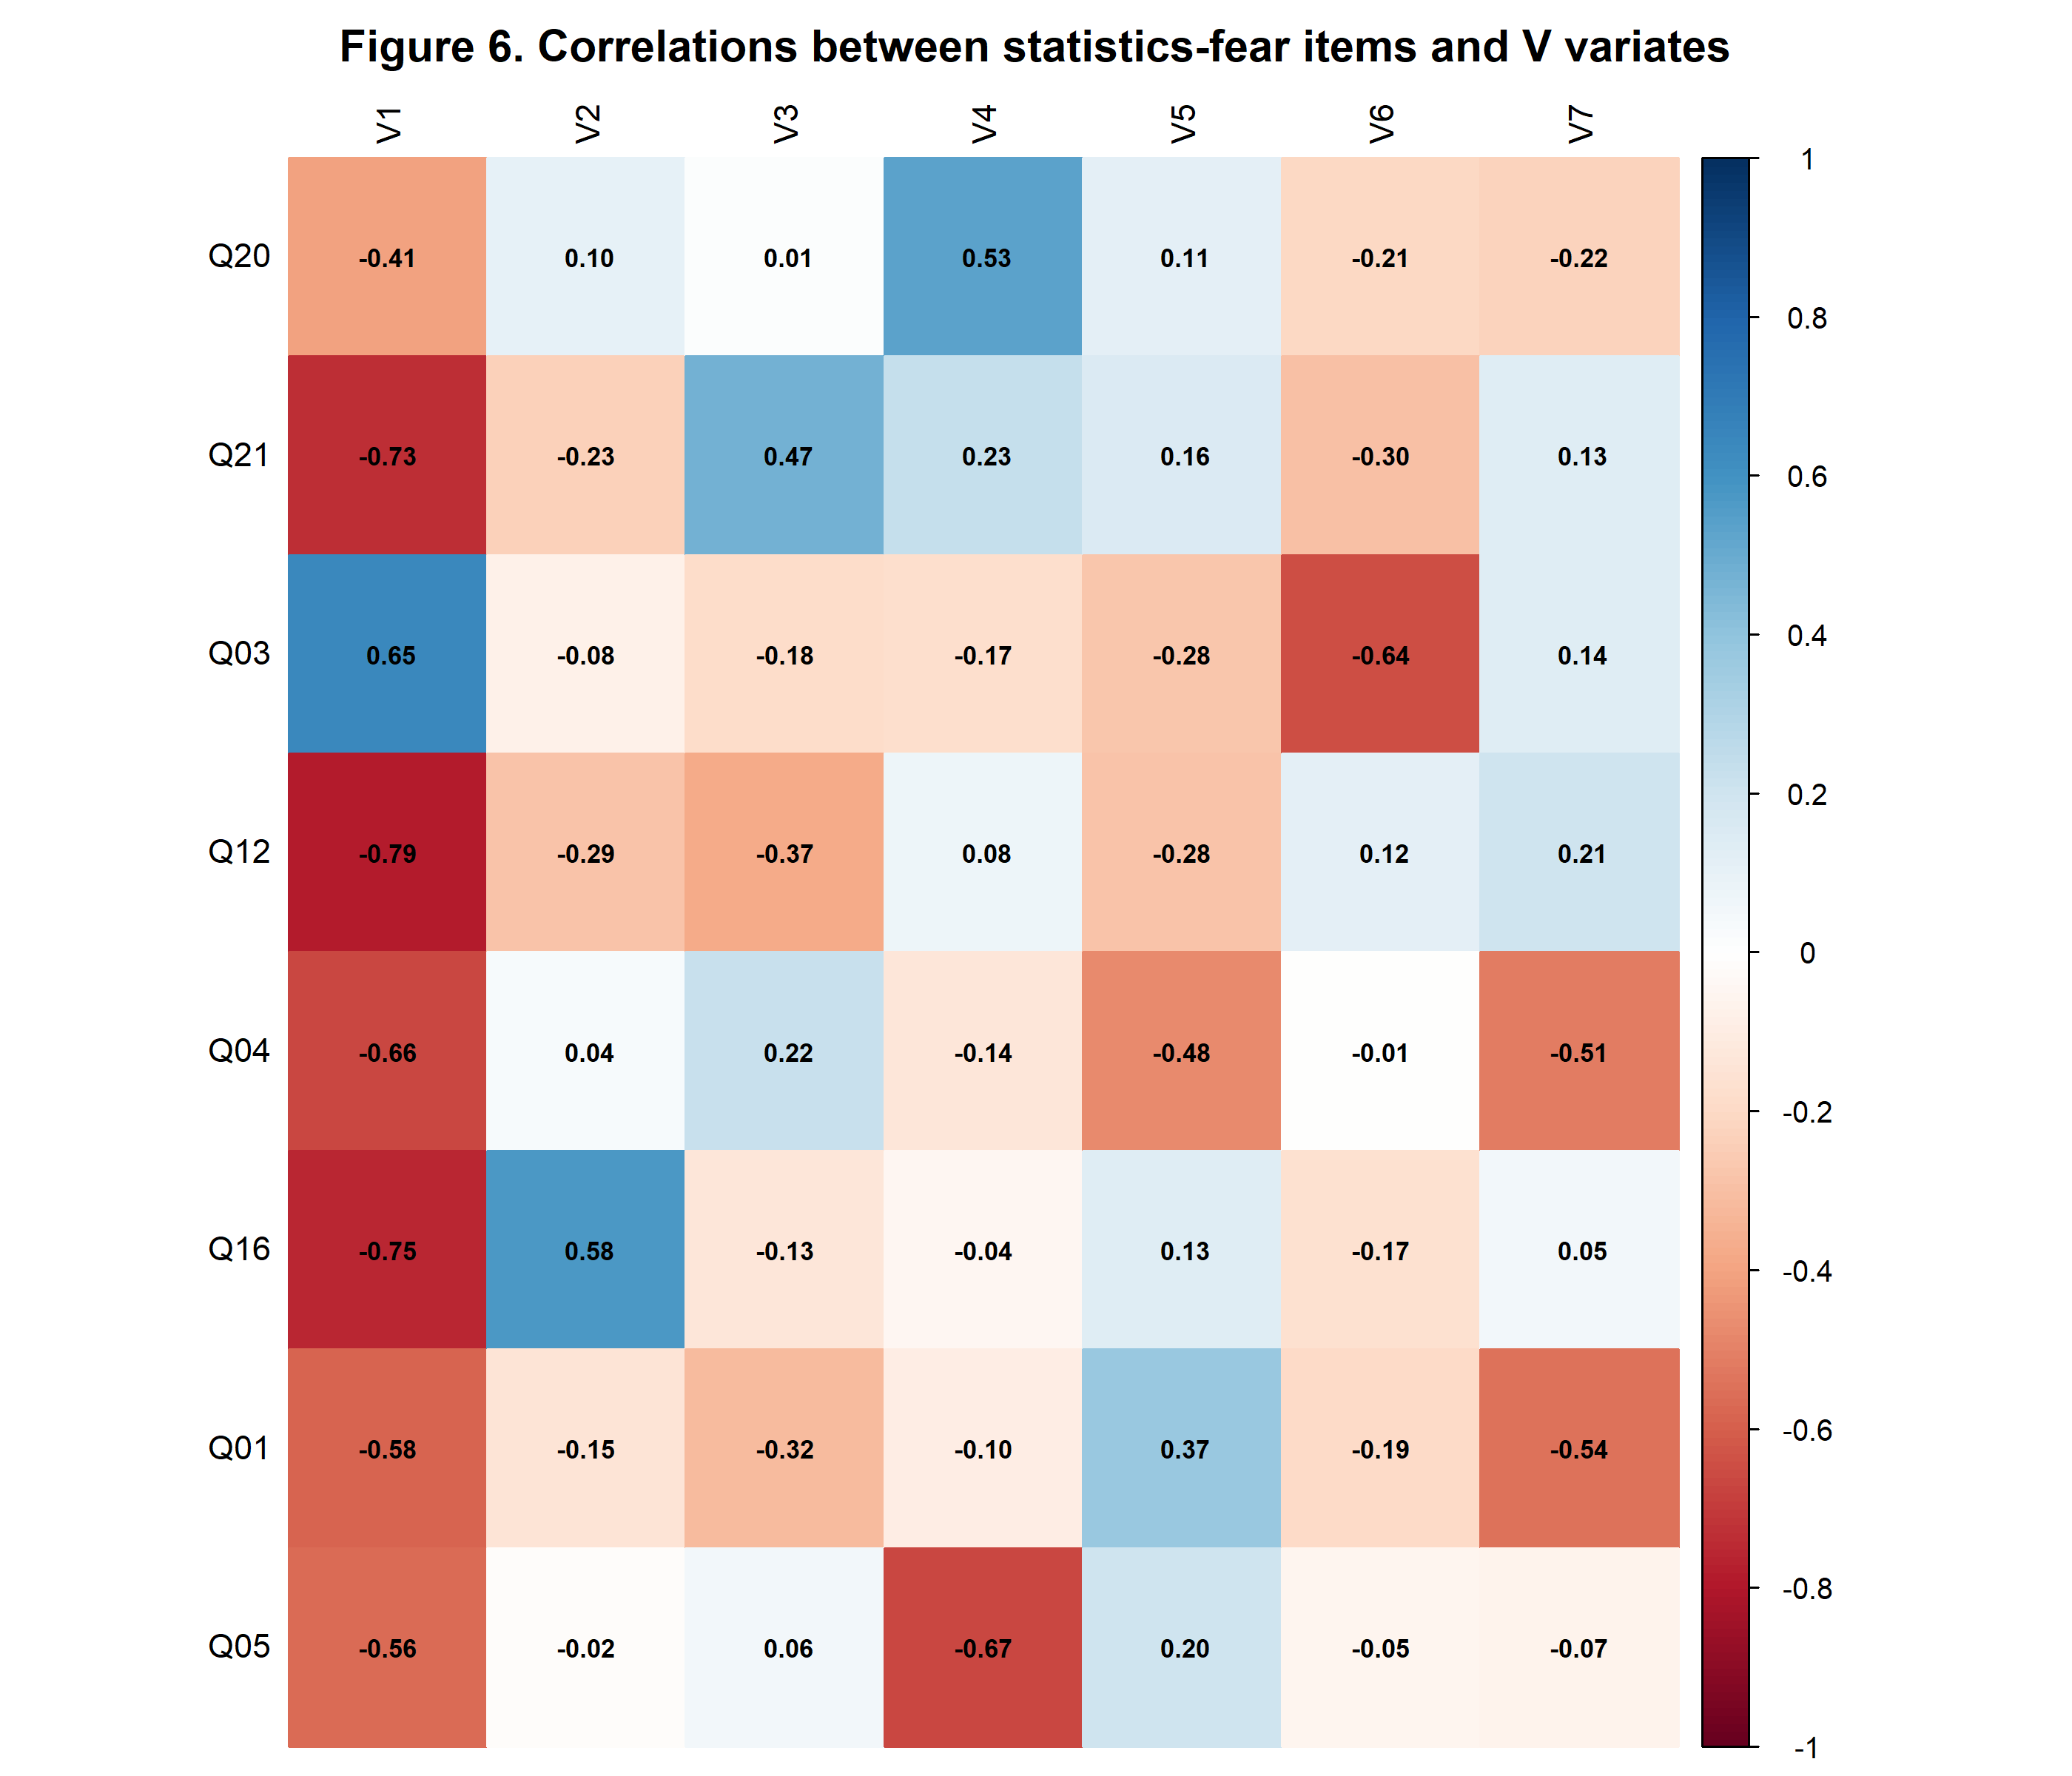
What it showsOn U1, Q18 (|r| = .787), Q07 (.765), Q14 (.737) and Q13 (.719) were strongest. On V1, Q12 (.790), Q16 (.755), Q21 (.733) and Q04 (.662) were strongest; Q03 loaded .648 in the opposite orientation.
Why it mattersFunction 1 was not driven by one isolated survey item. Several indicators from each construct contributed to the shared pattern.
LimitationCanonical signs are arbitrary: multiplying both variates by −1 leaves the correlation unchanged. Absolute magnitude and the pattern of signs should be interpreted with the original questionnaire wording.
04 · Redundancy and retained scores
Later functions added little cross-set explanation
Redundancy translates the canonical relationship into variance in one observed set explained through the opposite variate.| Function | Set 1 extracted | Set 1 redundancy | Set 2 extracted | Set 2 redundancy |
|---|---|---|---|---|
| 1 | 44.47% | 24.91% | 42.68% | 23.90% |
| 2 | 10.36% | 0.72% | 6.38% | 0.44% |
| 3 | 8.27% | 0.34% | 7.04% | 0.29% |
| 4 | 12.44% | 0.25% | 10.68% | 0.21% |
| All 7 cumulative | 100.00% | 26.27% | 91.04% | 24.89% |
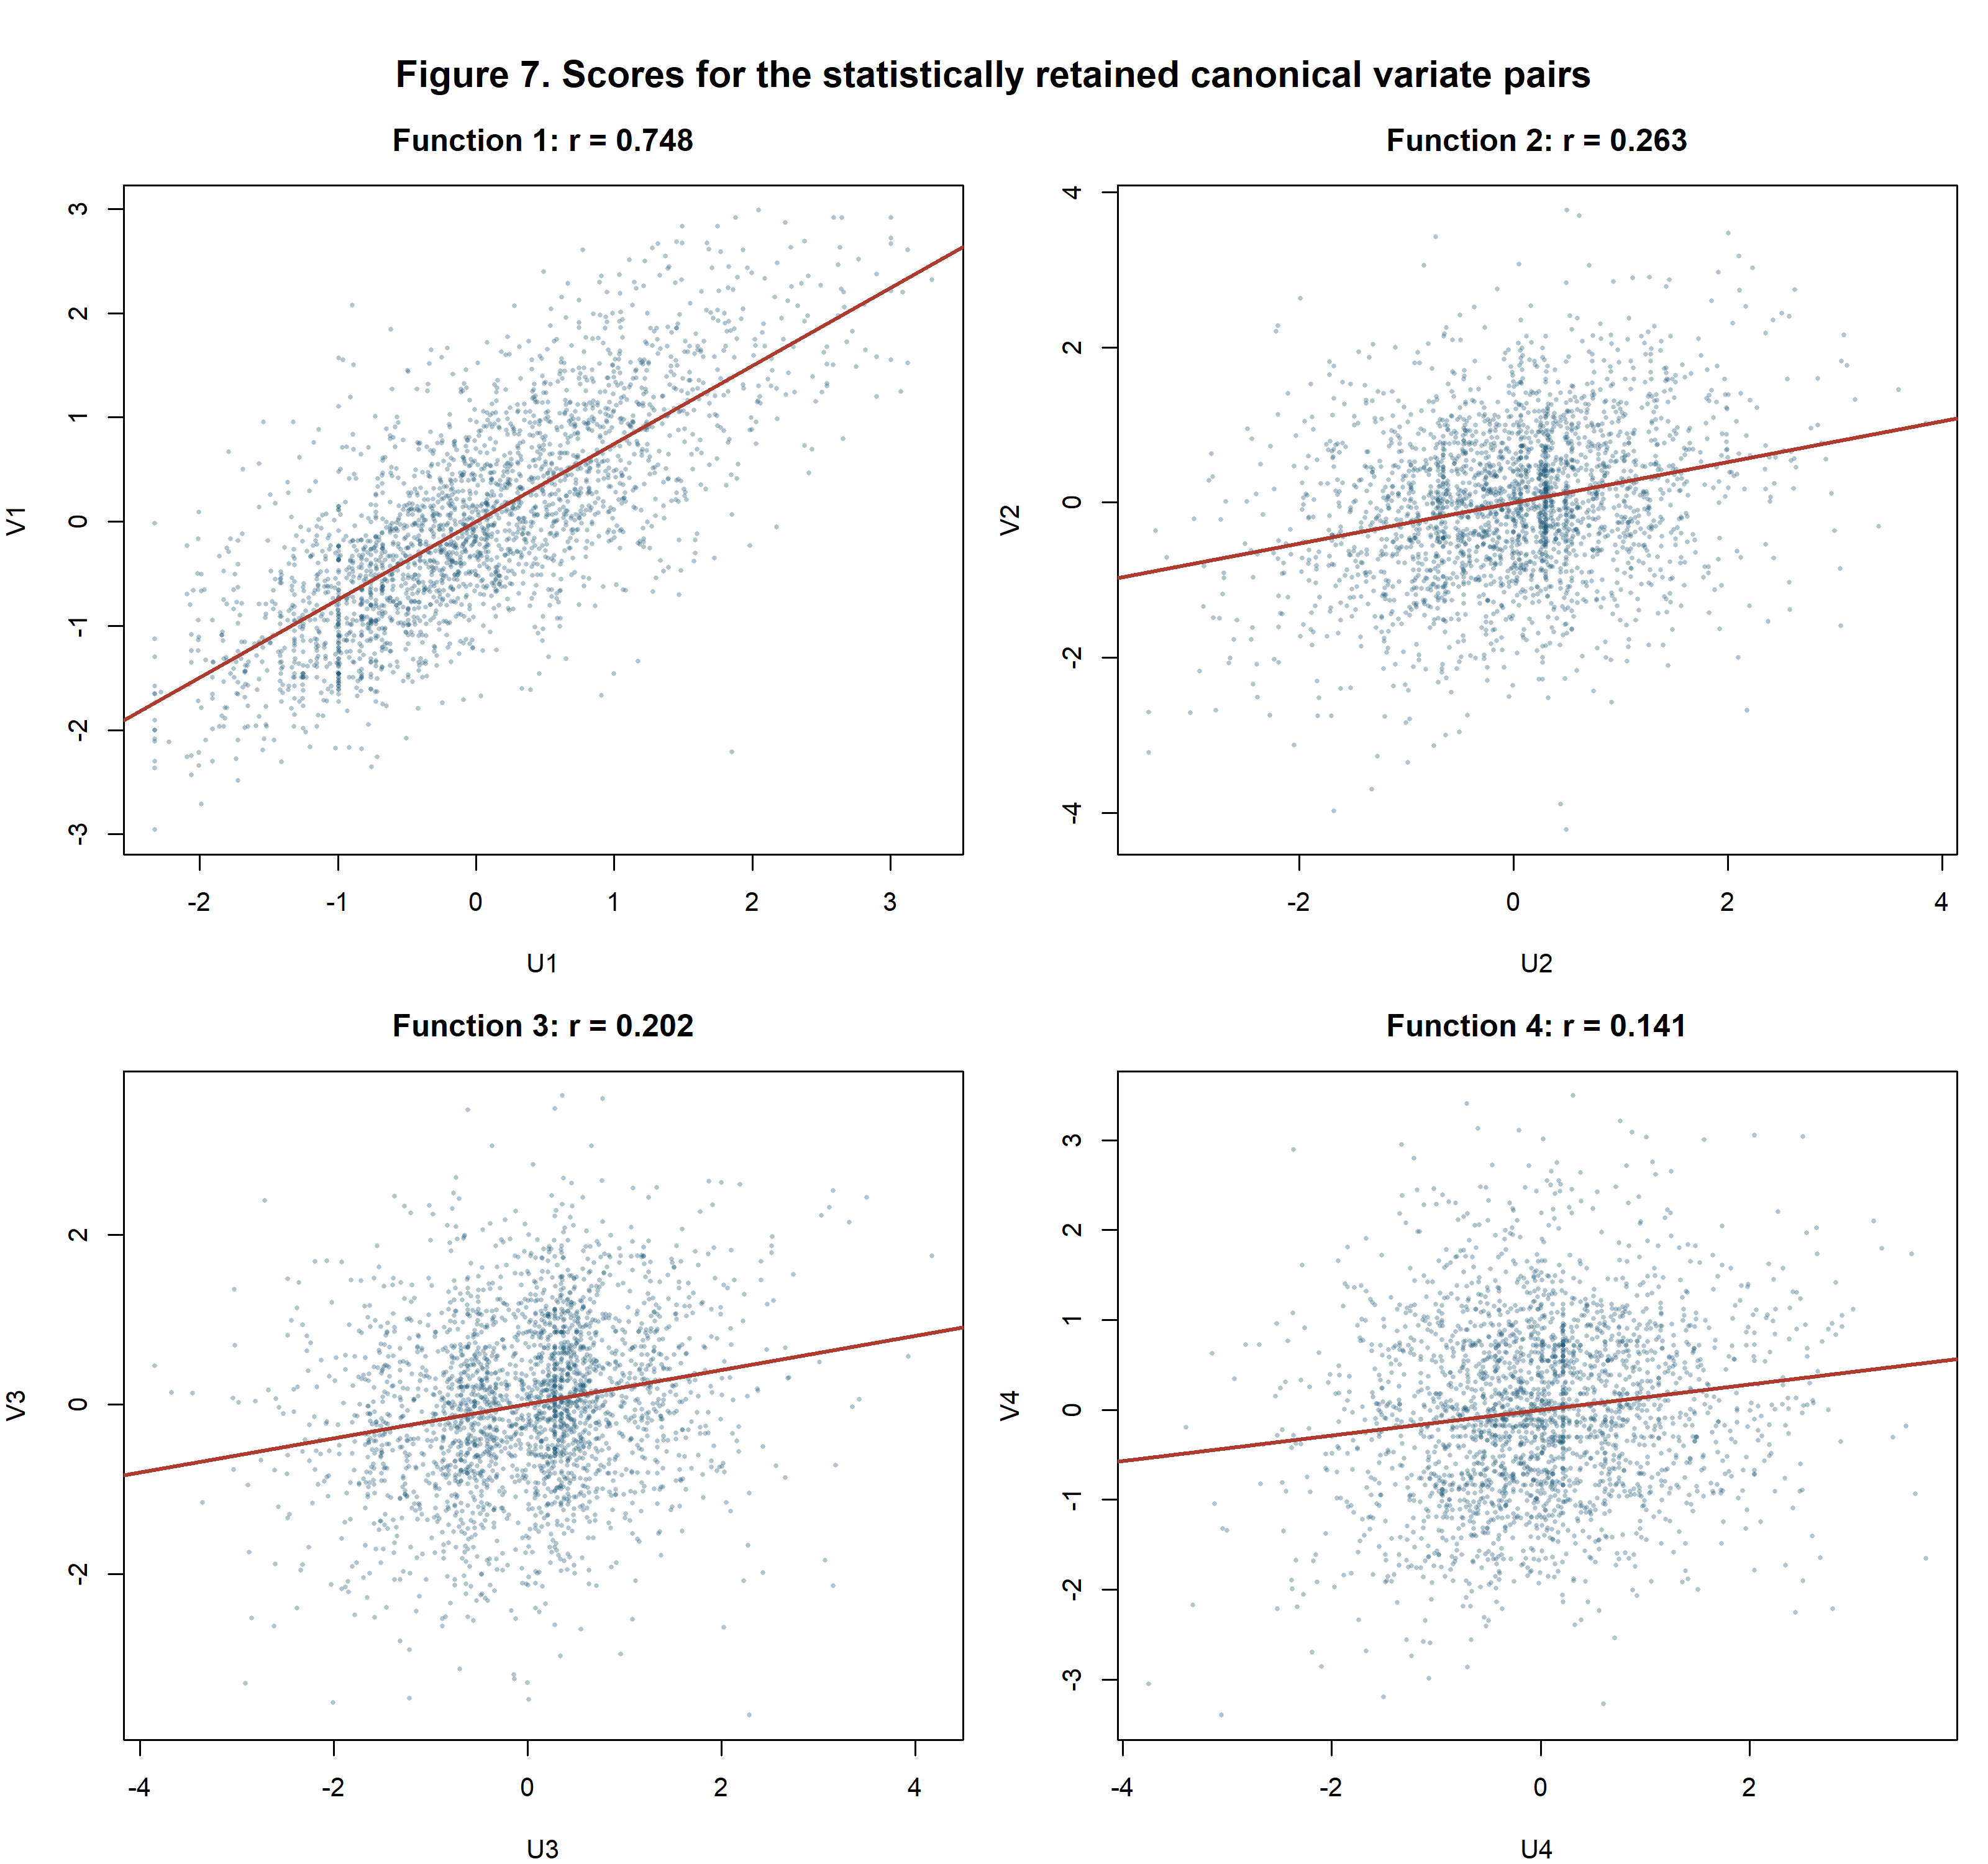
What it showsFunction 1 accounted for 24.91% of computer-fear variance through V1 and 23.90% of statistics-fear variance through U1. The remaining six functions increased cumulative redundancy only to 26.27% and 24.89%.
Why it mattersAlmost all practically useful cross-set explanatory value came from the first function, reinforcing a one-dominant-dimension interpretation.
LimitationRedundancy is descriptive and asymmetric. It does not establish that one form of fear produces the other, nor does it replace construct-validity evidence.
A dominant first relationship
The first canonical correlation was 0.748, indicating 56.0% shared variance between the first computer-fear and statistics-fear variates. This was far larger than the second, third and fourth functions, whose shared variances were 6.93%, 4.07% and 2.00% respectively.
Sequential Wilks' lambda tests retained four functions statistically. The sharp fall after Function 1 shows why statistical significance and substantive importance must be considered together, especially with a sample of 2,571 respondents.
What defined the first function
All seven computer-fear items loaded in the same direction on the first computer variate, with the largest absolute structure correlations for Q18, Q07, Q14 and Q13. On the statistics side, Q12, Q16 and Q21 contributed most strongly in the same orientation, while Q03 moved in the opposite direction.
The signs of canonical variates are arbitrary and can be reversed without changing the relationship. Interpretation therefore focuses on absolute loading magnitude and the pattern across items rather than treating a negative sign as a negative effect.
Redundancy and conclusion
The first statistics-fear variate explained 24.9% of variance in the computer-fear item set, while the first computer-fear variate explained 23.9% in the statistics-fear set. Later functions added relatively little cross-set explanatory value.
The defensible conclusion is that the two fear profiles share one strong general dimension, followed by several statistically detectable yet much smaller relationships. The analysis establishes multivariate association, not causation, and the item codes should be interpreted with the original questionnaire wording when substantive labels are assigned.
People behind the project